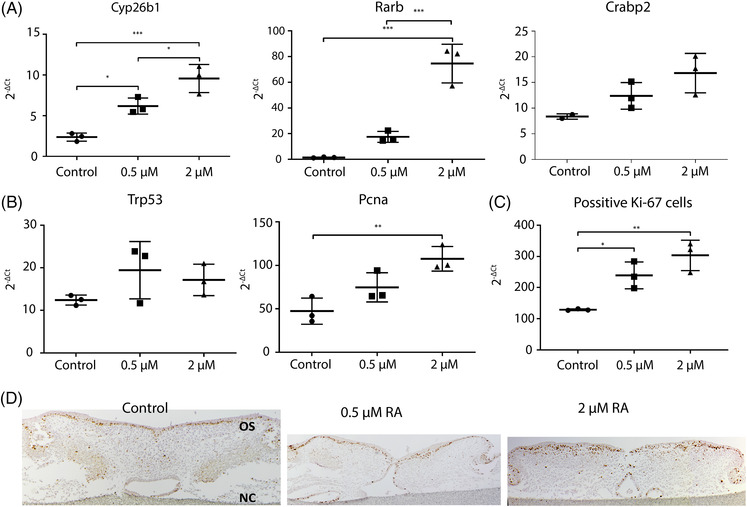
FIGURE 3.

Gene expression analysis. Quantitative real‐time PCR was performed with RNA isolated from mouse palates cultured for 4 days with 0.5–2 μM or without retinoic acid. (A) Expression of retinoic acid‐responsive genes. Data are represented as the mean ± SD (N = 3). * p < 0.05, *** p < 0.001, compared with the controls. (B) Trp53 and Pcna gene expression. Data are represented as the mean ± SD (N = 3). ** p < 0.01. (C) Proliferation marker KI‐67 positive cells. Data are represented as the mean ± SD (N = 3. * p < 0.05, ** p < 0.01, compared with the controls. (D) KI‐67 immunohistochemistry. Representative pictures of the staining. OS: oral side. NC: nasal cavity
