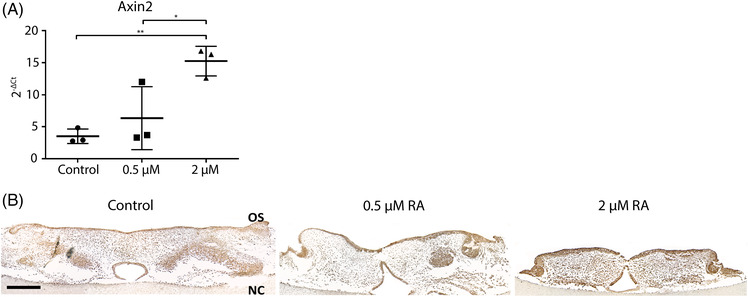
FIGURE 4.

WNT signaling target gene expression. (A) Axin2 gene expression. Data are represented as the mean ± SD (N = 3). * p < 0.05, ** p < 0.01. (B) AXIN2 immunohistochemistry. Representative pictures of the staining. Scale bars: 200 μm. OS: oral side. NC: nasal cavity
