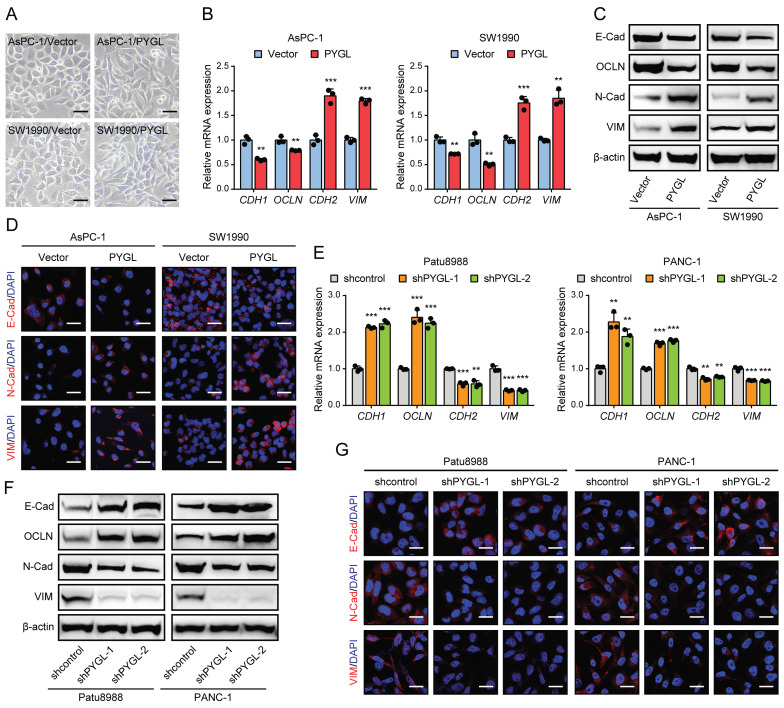
Figure 2.
PYGL induces EMT in PDAC cells. (A) Morphology changes of AsPC-1 and SW1990 following by PYGL overexpression (scale bar, 50 μm). (B) The mRNA expression levels of E-cadherin (CDH1), Occludin (OCLN), N-cadherin (CDH2), and Vimentin (VIM) following by PYGL overexpression as revealed by qRT-PCR. (C) The protein expression levels of E-cadherin (E-Cad), Occludin (OCLN), N-cadherin (N-Cad), and Vimentin (VIM) following by PYGL overexpression as revealed by western blotting. (D) Immunofluorescence (IF) analyses of E-Cad, N-Cad, and VIM (in red) following by PYGL overexpression (scale bar, 25 μm). (E-G) The expression of EMT markers following by PYGL knockdown in Patu8988 and PANC-1 cells as revealed by qRT-PCR (E), western blotting (F), and IF staining (G) (G: scale bar, 25 μm). **P < 0.01 and ***P < 0.001.

