Figure 1.
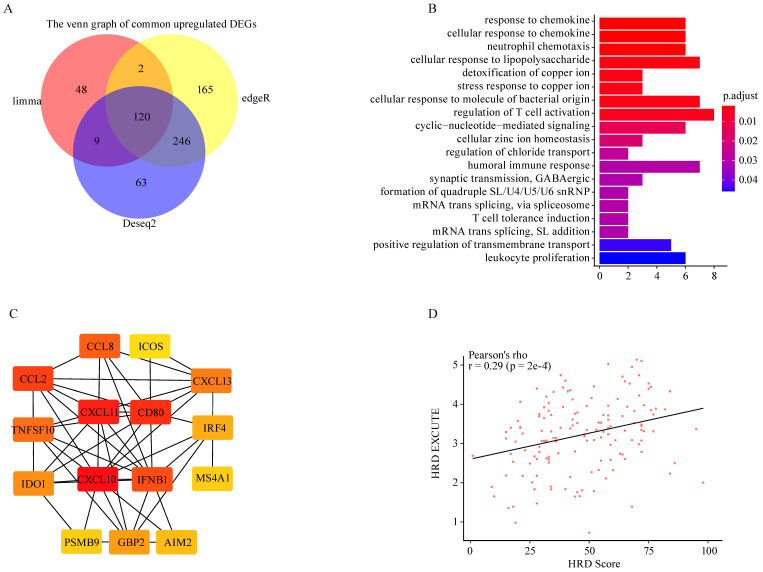
HRD promoted immune-transcriptomic phenotype in ovarian cancer. (A) Venn map of common upregulated genes in HRD-high group among Limma, EdgeR and Deseq2 methods. (B) The GO biological process enrichment of upregulated genes in HRD-high group. (C) The correlation network of 15 hub genes generated by STRING and Cytoscape app. The correlation degree increased as the box color turned from red to yellow. (D) The scatter was plotted to present the correlation between HRD and HRD-EXCUTE.

