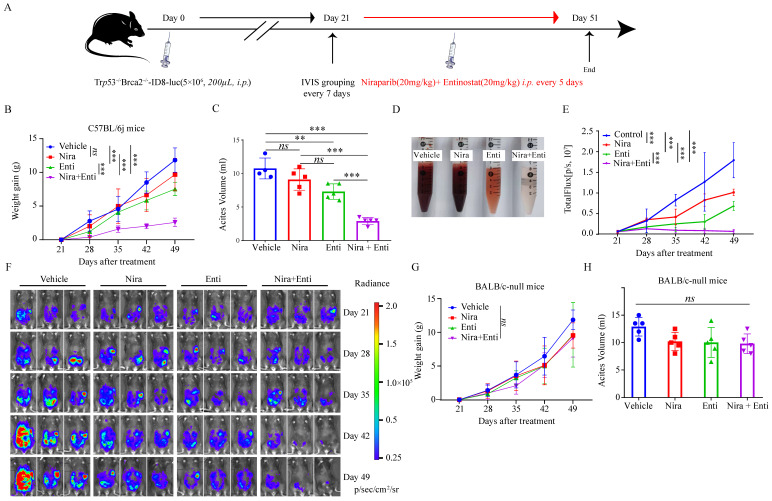
Figure 6.
Niraparib combined with Entinostat suppressed HRD ovarian tumor growth in vivo. (A) Diagram illustrated the processes of animal experiment. (B) The tumor burden was evaluated by weighing weekly after treatment. Data were presented by mean value of 5 mice per group ± standard error. (C) Bar plot showed ascites volume (ml) by the end of experiment in four subgroups. (D)The picture showed the bloody degree of ascites in four subgroups. A volume of 6ml ascites in each subgroup was collected for examination. (E) The tumor burden was evaluated by quantifying total flux with PE Living Image software. Data were presented by mean value of 5 mice per group ± standard error. (F) Bioluminescence of C57BL/6j mice after inoculation of Trp53-/-Brca2-/--ID8-Luc cells. (G) The tumor burden was evaluated by weighing weekly after treatment. Data were presented by mean value of 5 mice per group ± standard error. (H) Bar plot showed ascites volume (ml) by the end of experiment in four subgroups. Nira: Niraparib, Enti: Entinostat.

