
FIGURE 3.
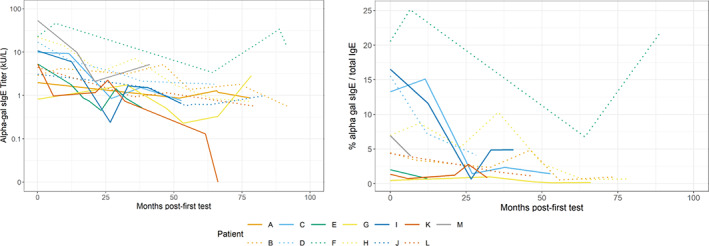
Galactose‐alpha‐1,3, galactose specific IgE results by month since first test among patients with Alpha‐gal Syndrome, University of North Carolina Allergy Clinic, 2010–2019. Alpha‐gal sIgE results are shown by month post‐first test 13 patients with at least five tests. Month 0 is the referent time point, indicating the initial test in chart. One patient (patient K) demonstrated a negative result, which is displayed as an sIgE value of 0. Note that while colors have been repeated, this represents no association between these patients; line types differentiate results from different patients.