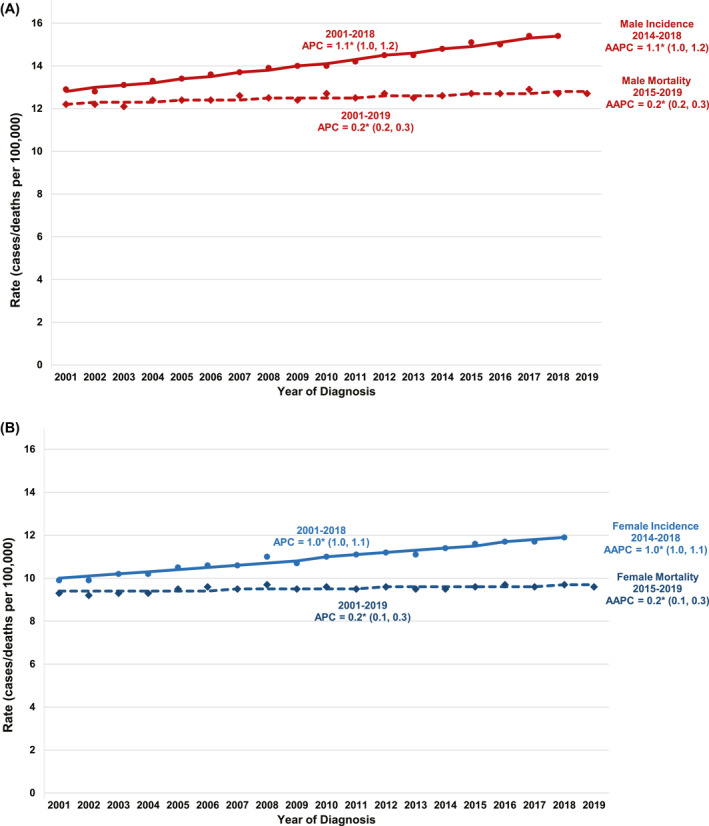
FIGURE 4.

Trends in age‐standardized incidence (2001–2018) and mortality (2001–2019) rates for pancreas cancer, for all racial/ethnic groups combined and all ages combined, are illustrated in (A) males and (B) females. Trends were estimated using joinpoint regression and characterized by using the annual percent change (APC), the slope of a single segment, and the average APC (AAPC), a summary measure of the APCs over a fixed 5‐year interval. Joinpoint models with up to three joinpoints are based on rates per 100,000 population and are age standardized to the 2000 US standard population (19 age groups; US Bureau of the Census. Current Population Report P25‐1130. US Government Printing Office; 2000). Incidence rates were delay‐adjusted and covered 92% of the US population, and mortality covered the entire United States. APCs and AAPCs with an asterisk (*) were statistically significantly different from zero (p < .05)
