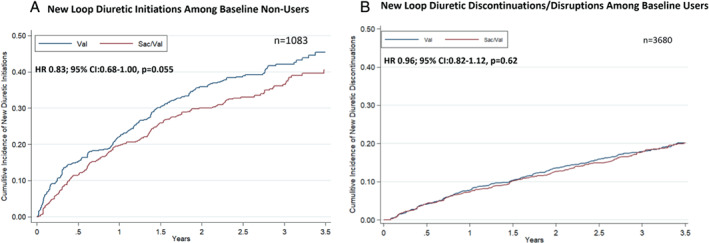
Figure 3.

Treatment effect on loop diuretic utilization in study follow‐up. Kaplan–Meier curves displaying (A) the time to loop diuretic initiation among patients not on loop diuretic at baseline and (B) time to discontinuation or disruption among patients being treated with loop diuretic at baseline. Disruption was defined as any interruption in diuretic use of ≥30 days. CI, confidence interval; HR, hazard ratio; Sac/Val, sacubitril/valsartan; Val, valsartan.
