FIGURE 2.

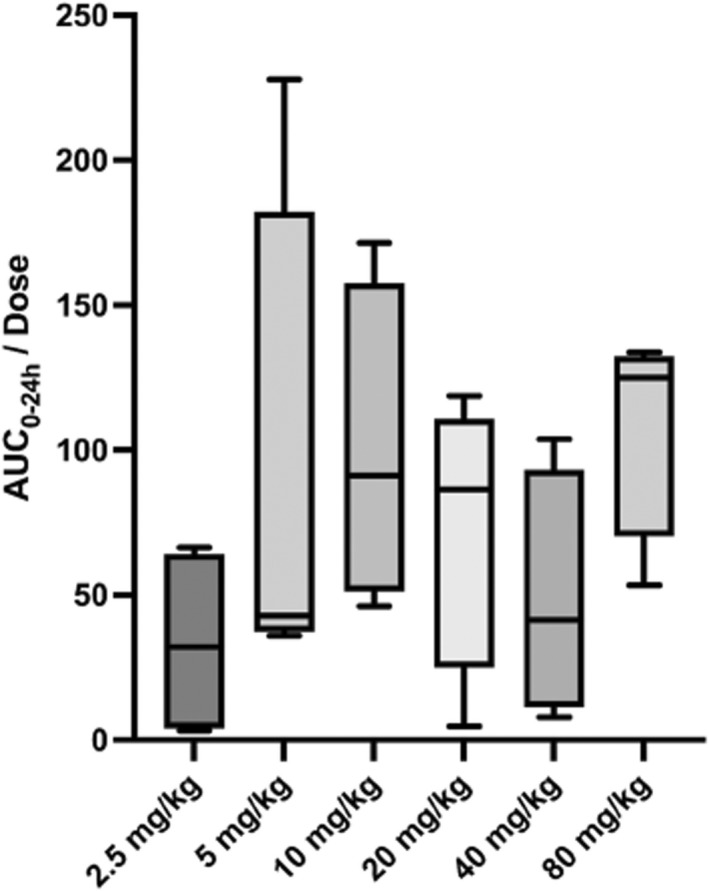
Box and whisker plot depicting AUC0‐24h/dose for each dosing group. AUC0‐24 was determined to be dose‐proportional using a one‐sample t‐test and Wilcoxon test.

Box and whisker plot depicting AUC0‐24h/dose for each dosing group. AUC0‐24 was determined to be dose‐proportional using a one‐sample t‐test and Wilcoxon test.