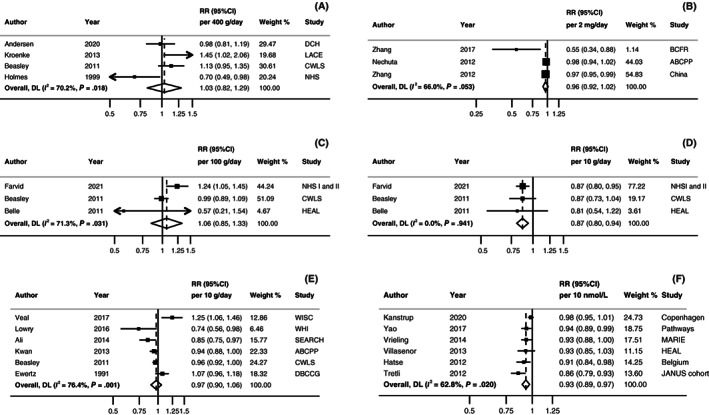
FIGURE 3.

Linear dose‐response meta‐analyses on (A) dairy product intake, (B) isoflavone intake, (C) carbohydrate intake, (D) fibre intake, (E) alcohol intake and (F) serum 25(OH)D and all‐cause mortality. Forest plots show the linear dose‐response results from the inverse variance DerSimonian‐Laird random‐effects models. Diamonds represent the summary relative risk (RR) estimates. Each square represents the RR estimate of each study and the horizontal line across each square represents the 95% confidence interval (CI) of the RR estimate. The increment units were (A) 400g/day, (B) 2 mg/day, (C) 100g/day, (D) 10 g/day, (E) 10 g/day, and (F) 10 nmol/L. ABCPP, After Breast Cancer Pooling Project; BCFR, Breast Cancer Family Registry; CI, confidence interval; CWLS, Collaborative Women's Longevity Study; DBCCG, Danish Breast Cancer Cooperative Group; DCH, Danish Diet, Cancer, and Health Study; HEAL, Health, Eating, Activity, and Lifestyle Study; MARIE, Mammary carcinoma risk factor Investigation; NHS, Nurses' Health Study; RR, Relative risk; SEARCH, Studies of Epidemiology and Risk Factors in Cancer Heredity Breast Cancer Study; WHI, Women's Health Initiative; WISC, Wisconsin In Situ Cohort Study. [Correction added after first online publication on 29 November, 2022: In Figure 3 legend, there were repeated text and have been removed.]
