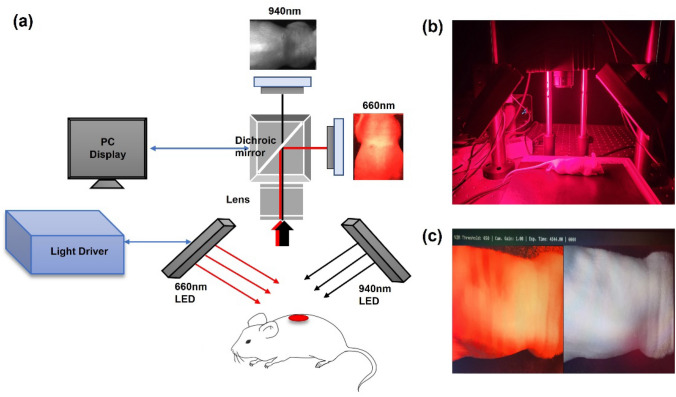
Fig. 1.
a Schematic diagram of the dual-wavelength simultaneous acquisition imaging system setup for oxygen saturation measurement. b The light source was arranged at a 45-degree angle and a camera including a lens was placed in the middle in the actual experimental setup. c Graphic user interface for image output

