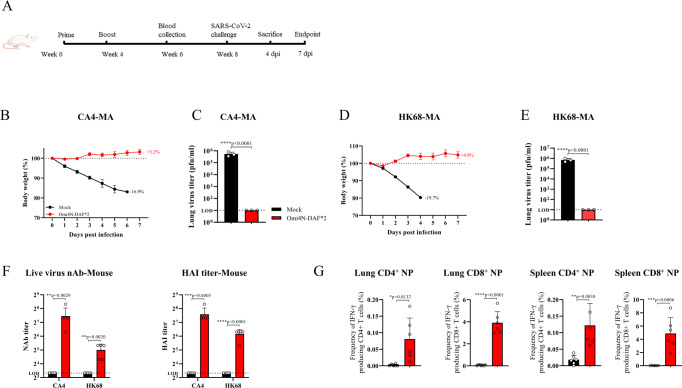
Fig. 6. Protection against influenza virus challenge in mice prime-boost immunized with DelNS1-RBD4N-DAF LAIV.
A Illustration of schedule of immunization, blood collection and influenza virus challenge for BALB/c mice. BALB/c mice were intranasally prime-boost vaccinated with Omi4N-DAF (2 × 10⁶ pfu) or PBS (n = 6 for each group), and then challenged with mouse-adapted influenza virus strains matching the influenza subtype of vaccines (CA4-) (H1N1, 5 × 10³ pfu) or HK68-MA (H3N2, 1 × 10⁴ pfu) (n = 3 for each group)) 4 weeks after boost immunization. Body weight changes in mice following influenza virus challenge were tracked (n = 6 for each group) until the control group reached the body weight loss cut-off (20%) for euthanization, in accordance with animal ethics protocols (B, D). Virus titers in the lungs were measured at 4 dpi (C, E). F BALB/c mice were prime-boost immunized intranasally with 2 × 10⁶ pfu of Omi4N-DAF or PBS (mock) (n = 5 for each group). Sera were collected 14 days after the second immunization for testing of neutralization titers and hemagglutination inhibition (HAI) titers against live influenza viruses CA4 (H1N1) or HK68 (H3N2). G At 5 weeks after the second immunization, 2 μg of PerCP-Cy5.5 conjugated CD45-specific antibody was injected i.v. via the tail vein 5 min before sacrifice. Lung cells and splenocytes were obtained and stimulated with or without influenza NP peptides, overnight in the presence of BFA. Surface markers (CD69, CD103, CD4, CD8, and Zombie) were stained, and cells then fixed and permeabilized. Intracellular IFNγ was then stained with specific antibodies. Omi4N-DAF induced NP-specific tissue-resident memory T (Trm) cell responses in lungs (CD45- IFN-γ+ CD69+ CD4+ T cells and CD45- IFN-γ+ CD69+ CD103+ CD8+ T cells) and spleens (CD45- IFN-γ+ CD4+ and CD8+ T cells). Percentages of T cell subsets in immunized (n = 6) and mock (n = 6) groups were compared. MA mouse-adapted. HAI hemagglutination inhibition. LOD lower limit of detection. Error bars represent mean ± SD. Statistical comparisons between means were performed by Student’s t test (2-tailed): ****p < 0.0001, ***p < 0.001, **p < 0.01, *p < 0.05. Mouse cartoons created with BioRender.com.

