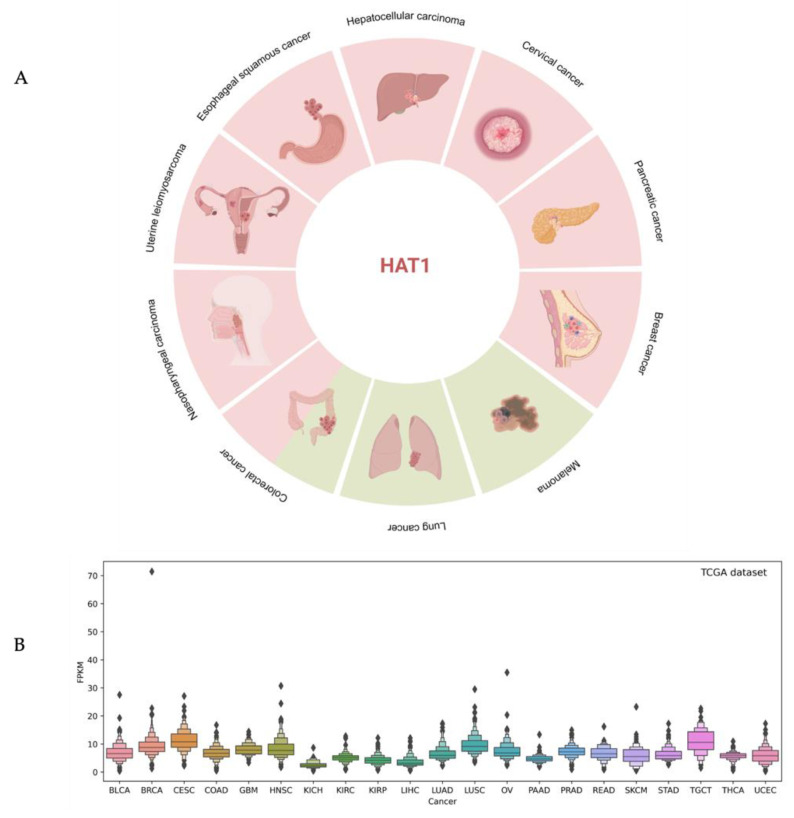
Figure 4.
Overview of HAT1 expression in human cancer. (A) Schematic representation of the different expression levels of HAT1 in the described cancer. The red and green squares represent the upregulation or downregulation of HAT1 expression levels, respectively. (B) The box plot depicts RNA expression levels in 17 different types of cancer from the TCGA dataset; ♦ represent outliers that differ significantly from the rest of the dataset.

