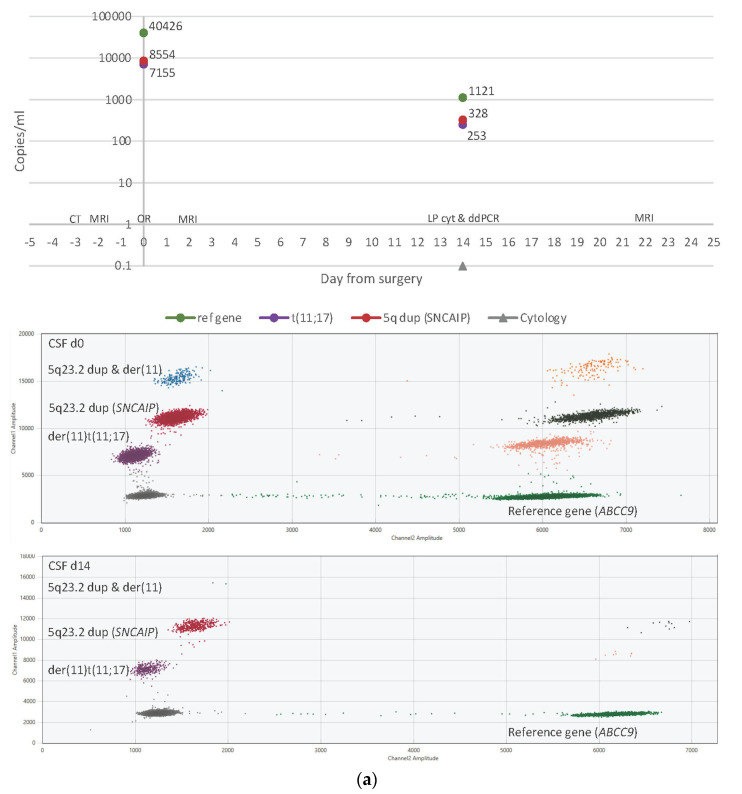
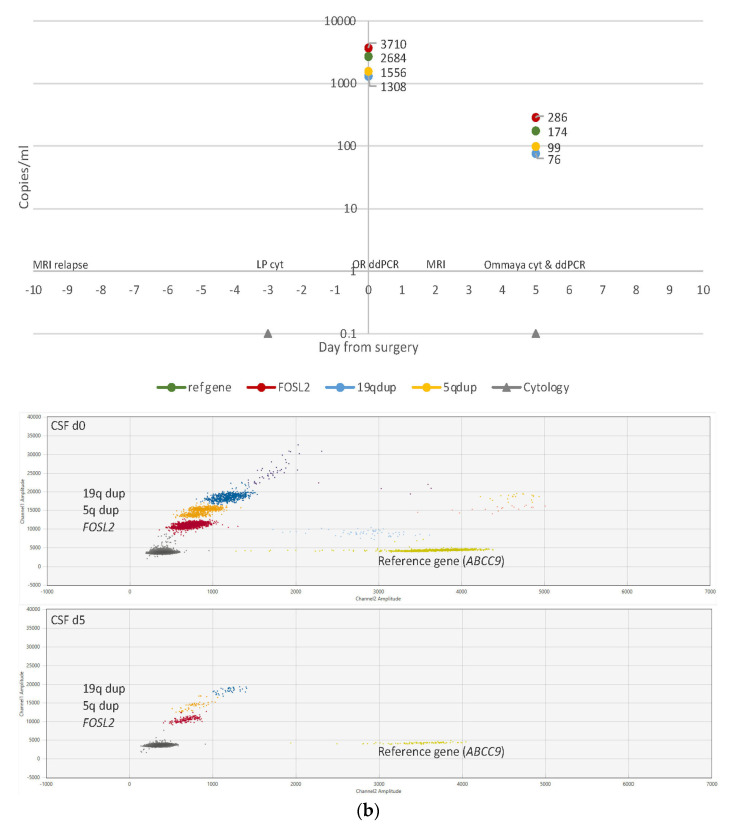
Figure 2.
Timelines (top panels) with sampling time points and results from CSF ctDNA ddPCR and CSF cytology. 2D fluorescence amplitude plots (bottom panels) showing output data generated by the QX Manager™ Software (BioRad, Hercules, CA, USA). Y-axis, end-point FAM-fluorescence from targets. X-axis, end-point HEX-fluorescence from reference gene (ABCC9). (a) Results for patient 1 on d0, prior to surgery, and d14 post-operatively. Targets: der(11)t(11;17) in purple, 5q dup/SNCAIP in red, and both targets in blue. Empty droplets in grey, reference positive droplets in green. Double positives (target and reference) in multiple colors on the right-hand side of the plot: der(11) and reference in pink, 5q dup and reference in dark green, both targets and reference in orange (b) Results for patient 15 on d0, prior to surgery, and d5 post-operatively. Targets: FOSL2 c.383G>A in red, 5q13.3 tandem duplication in orange, and 19q12 tandem duplication in blue, and all targets in purple.. Empty droplets in grey, reference positive droplets in mustard. Double positives (target and reference) in multiple colors on the right-hand side of the plot: FOSL2 and reference in light blue, 5q13.3 tandem dup and reference in pink, 19q12 tandem dup and reference in yellow, all targets and reference in wine.


