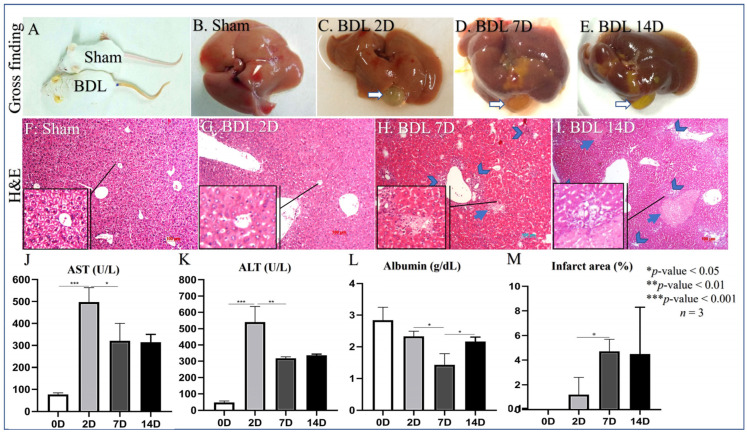
Figure 1.
Evidence of liver damage in BDL mice. (A) Macroscopic evidence of jaundice in BDL mice compared to control animals. (B) Liver macroscopic appearance in control mice. (C–E) Liver macroscopic appearance in BDL mice 2, 7, and 14 days after BDL. (F) Microscopic appearance of liver in control animals (H&E staining). (G–I) Microscopic appearance of liver in BDL animals (H&E staining) 2, 7, and 14 days after BDL; head arrows indicate portal reaction and inflammation; arrows indicate the necrotic area. (J–L) Levels of circulating AST/ALT/Albumin in BDL mice 0, 2, 7, and 14 days after BDL, * p < 0.05, ** p < 0.01, *** p < 0.001, n = 3. (M) Quantification of necrotic areas in BDL mice Sham (0), 2, 7, and 14 days after BDL, * p < 0.05, n = 3, 100 µm scale bare.

