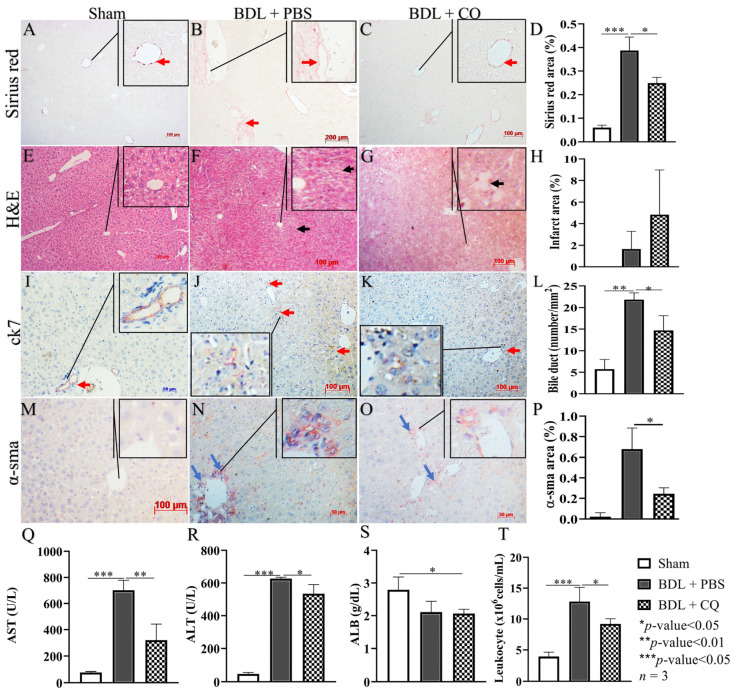
Figure 3.
Effects of CQ treatment effects on liver damage in BDL. (A–D) Representative Sirius red staining of liver tissues in Sham, BDL + PBS, and BDL + CQ animals with the respective quantification; red arrows indicate positive areas. (E–H) Representative H&E staining of liver tissues in Sham, BDL + PBS, and BDL + CQ animals with the respective quantification; black arrows indicate areas of necrosis. (I–L) Representative ck7 staining in liver tissues in Sham, BDL + PBS, and BDL + CQ animals with the respective quantification; red arrows indicate portal reaction due to bile duct proliferation. (M–P) Representative α-sma staining in liver tissues from Sham, BDL + PBS, and BDL + CQ animals together with the quantification; blue arrows indicate positive areas. (Q–S) ALT, AST, and albumin levels in Sham animals and BDL (2 days) animals treated either with CQ (BDL/CQ) or with PBS (BDL/PBS, control). (T) Peripheral leukocytes in Sham animals and BDL (2 days) animals treated either with CQ or with PBS (control). * p < 0.05, ** p < 0.01, *** p < 0.001, n = 3, 100 µm scale bar.

