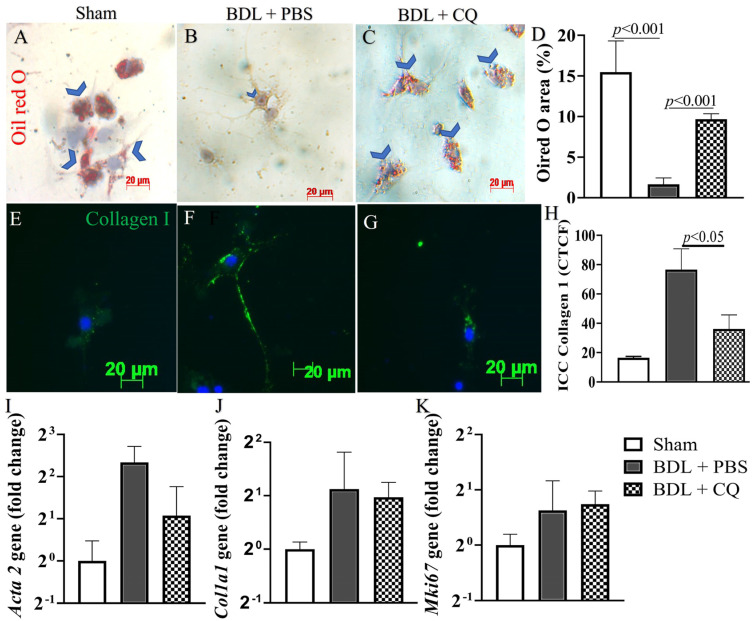
Figure 5.
Effects of CQ on HSC in vivo activation. (A–C) Representative images of Oil red O staining in HSC isolated from the three mice groups: Sham, BDL/PBS, and BDL/CQ; blue arrows indicate the positive areas. (D) Quantification of the surface of Oil red O staining areas, p < 0.05, n = 3. (E–G) Representative images of type I collagen staining in HSCs isolated from the three mice groups: Sham, BDL/PBS, and BDL/CQ; (H) Quantification CTCF (Correct Total Cell Fluorescence quantification) of Collagen staining, p < 0.05, n = 3. (I–K) mRNA levels of acta 2, col1a1, and Mki-67 markers in HSCs isolated from Sham, BDL/PBS, and BDL/CQ mice.

