Figure 6.
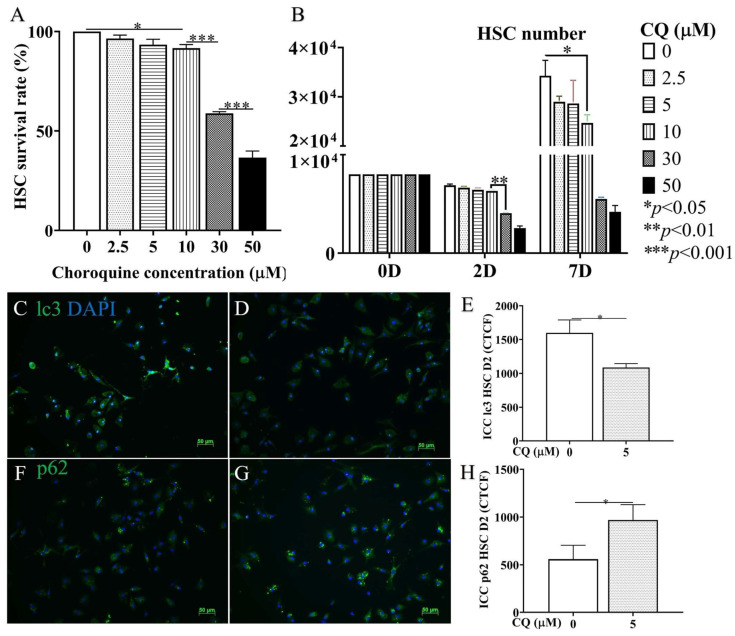
CQ cytotoxicity and autophagy effectiveness on HSCs in vitro. (A,B) Graphic comparison of CQ concentrations varying between 0, 2.5, 5, 10, 30, and 50 µM based on cytotoxicity and proliferation until 7D of culture (B) and 2D (A). (C,D) Representative images of ICC staining with lc3 antibody/DAPI of in vitro HSCs treated with 0 and 5 µM of CQ. (E) Graphic comparison of CTCF (Correct Total Cell Fluorescence quantification) from ICC staining. (F,G) Representative images of ICC staining with p62 antibody/DAPI of HSC treated with 0 and 5 µM of CQ. (H) Graphic comparison of CTCF from ICC staining. p-value: * < 0.05, ** < 0.01, *** < 0.001, n = 3, 50 µm scale bar.

