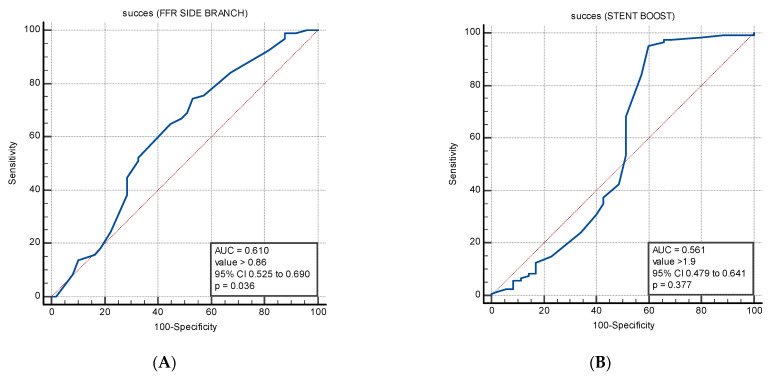
Figure 2.
ROC curves showing the prognostic sensitivity and specificity of (A) FFR values to predict a value of SESBL > 2. The AUC of FFR (0.61, 95% CI 0.525–0.690, p = 0.036) with the optimal cut-off value of >0.86, which provided Se = 74.5% and SP = 47% for the prediction of SESBL values > 2. (B) SESBL values to predict a value of FFR > 0.8. The AUC of SESBL (0.56,95% CI 0.479–0.641, p = 0.38) with the optimal cut-off value of >1.9, which provided Se = 95% and SP = 40% for the prediction of FFR values > 0.8.

