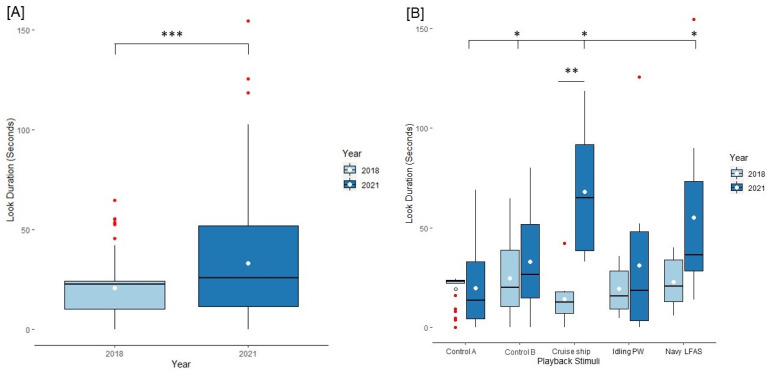
Figure 6.
Look duration responses broken down by playback stimuli and year. (A) Boxplots representing the interquartile range of look responses (seconds) by year. Outlier points are included in red. The means of each group are represented by the white circles in each box. (B) Boxplots illustrating the interquartile range of look duration responses across playback files and year. The top line with an asterisk denotes significance across playbacks and the lower line without endcaps denotes significance for a pairwise comparison across years. The dot that indicates the mean for control A is outlined with a black line. * = p < 0.05, ** = p < 0.01, *** = p < 0.001. Idling PW = idling personal watercraft.

