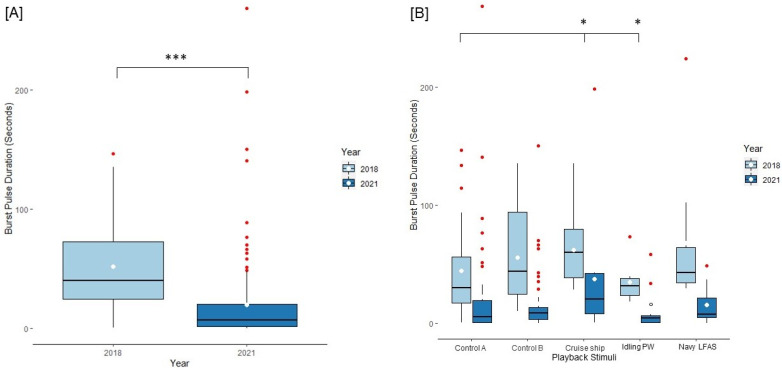
Figure 8.
Burst Pulse bout Duration Reponses separated by fixed effect factors. (A) Box and whisker plot of decreases in burst pulse duration responses across the years 2018 and 2021. (B) Burst pulse duration responses grouped by year and playback type. * = p < 0.05, *** = p < 0.001. Means are denoted with white circles and the Idling personal watercraft is given with a black outline around the white circle. Outliers are denoted by red dots. Idling PW = idling personal watercraft.

