Figure 1.
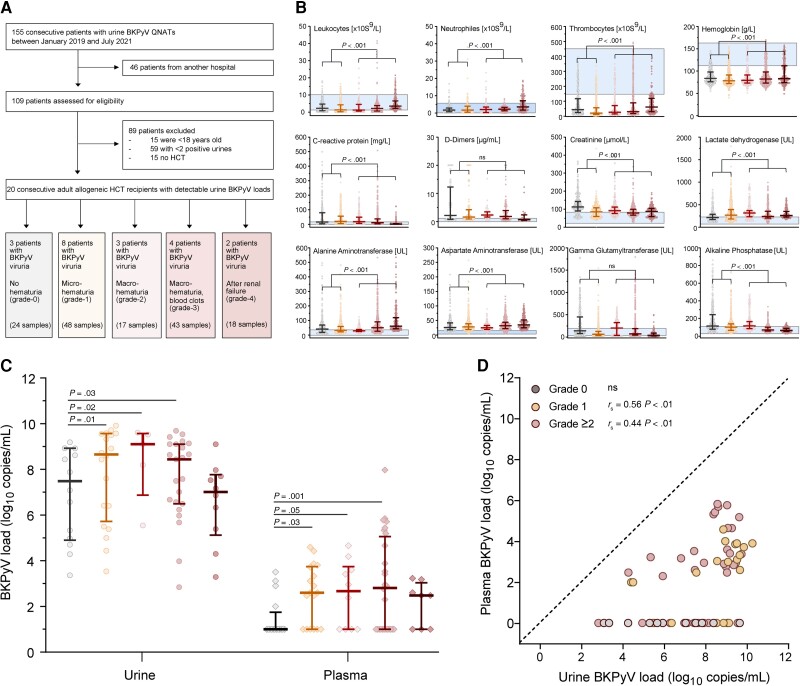
Patients' characteristics. The epidemiology and patients' demographics are displayed in Supplementary Table 1. Patients provided longitudinal plasma (total n = 73) and urine samples (total n = 77) after HCT. Samples from patients without hematuria are displayed in grey, with microscopic (grade 1) hematuria in yellow, and hematuria grade ≥2 in shades of red according to severity. A, Flow diagram of the study. B, Cellular and blood chemistry parameters of the 20 HCT patients at the onset of BKPyV replication (± 7 d; median, 25th and 75th percentiles, minimum, maximum). Blue area indicates the reference values of the parameters in the general healthy population (P value by Mann-Whitney U test). C, Urine and plasma BKPyV loads of the 20 HCT patients by hematuria grade (median, 25th and 75th percentiles, minimum, maximum; P value by Mann-Whitney U test). D, Time-matched urine and plasma samples of the 20 HCT patients (n = 72; dashed line indicates 100% agreement level, P value by Spearman rank correlation). Abbreviations: BKPyV, BK polyomavirus; HCT, hematopoietic cell transplantation; ns, not significant; QNAT, quantitative nucleic acid testing.

