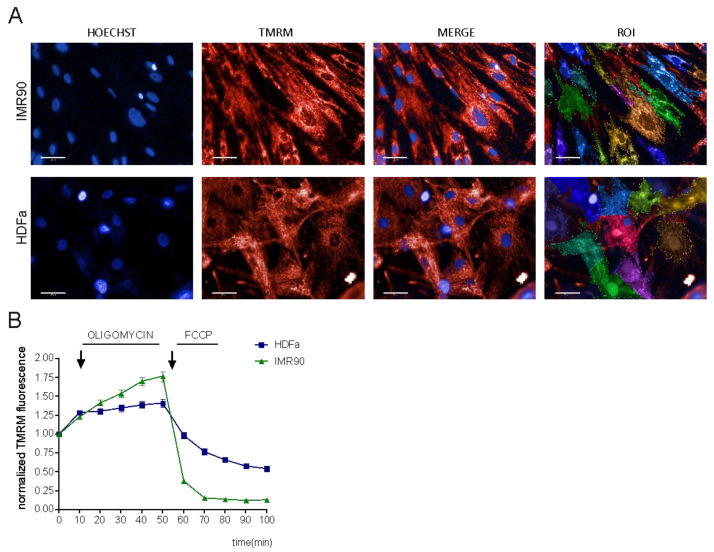
Figure 1.
High-content measurement of ΔΨm in cell cultures. (A) Representative images of primary human fibroblasts (HDFa, IMR-90) stained with TMRM and Hoechst (scale bar 50 µm). (B) Mitochondrial membrane potential (ΔΨm) kinetics of human fibroblasts. To study the changes in ΔΨm, the cells were treated with oligomycin and FCCP. Data represent the mean ± SEM of 5–6 biological replicates.

