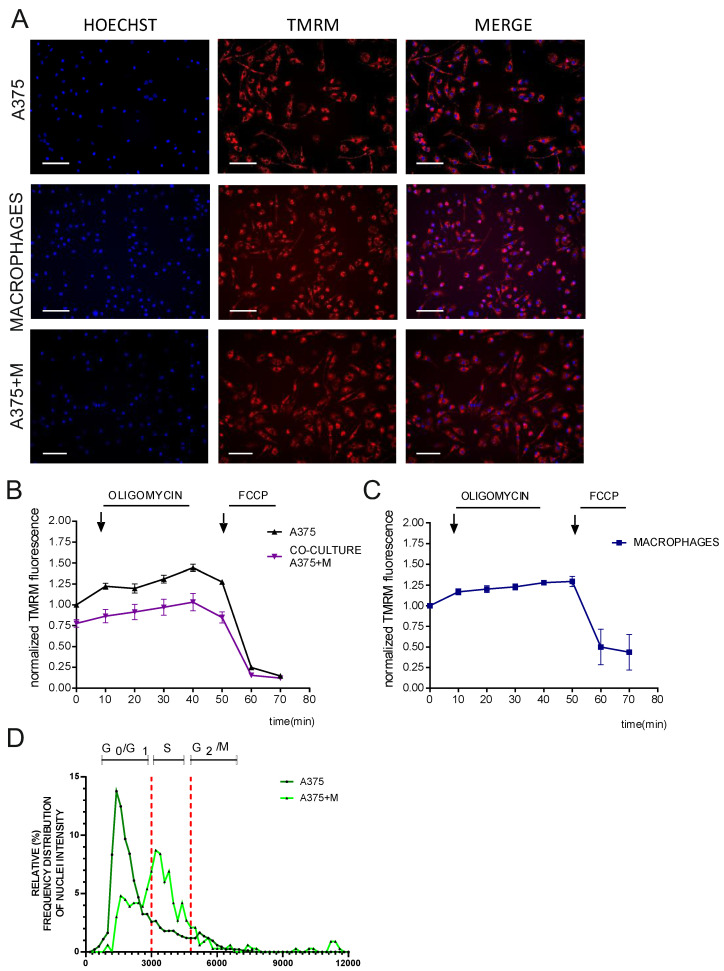
Figure 4.
High-content imaging of ΔΨm in cell co-cultures and machine learning quantification. (A) Representative images of melanoma A375 cells (cultured either alone or co-cultured) and macrophages treated with TMRM. White scale bars: 200 μm. (B,C) the respective TMRM analysis in basal conditions or exposed to oligomycin and FCCP. Data represent the mean ± SEM from 4 biological replicates. (D) Cell cycle phase distribution of melanoma A375 cells cultured either alone or in co-culture with macrophages. Dashed lines indicate the division of the three cell cycle phases: G0/G1, S, and G2/M. Representative graph reports the percentage of the frequency distribution of nuclei intensity in each cell cycle phase. Data represent the mean ± SEM from 4 biological replicates.

