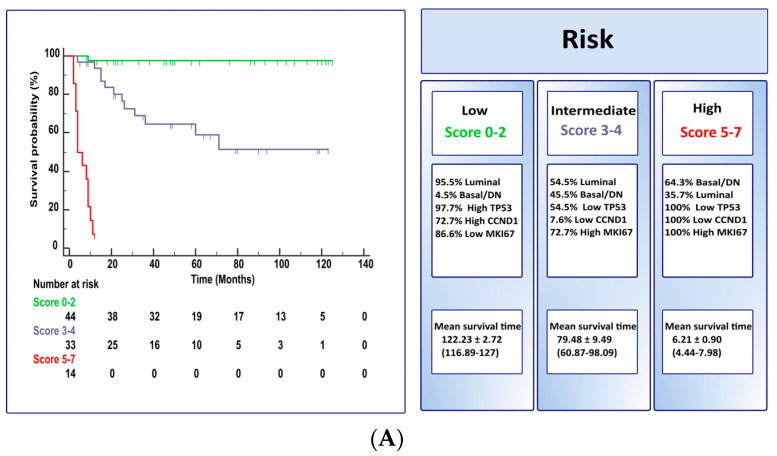
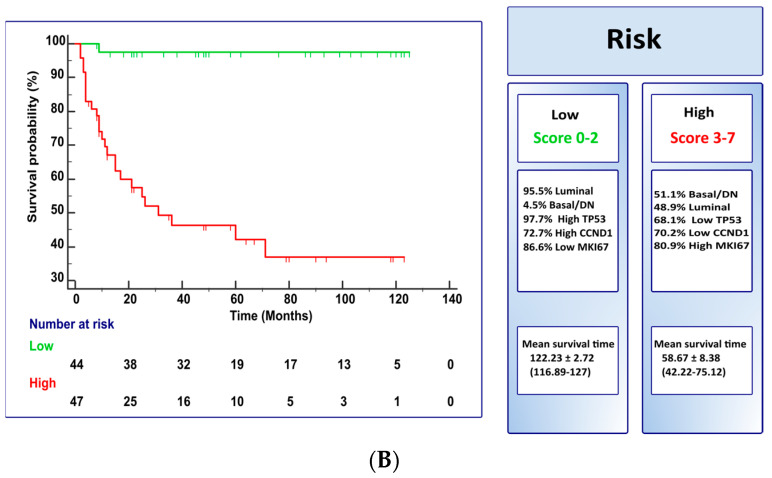
Figure 4.
Kaplan-Meir plots for cancer-specific survival and risk scores stratified as two (p < 0.0001; model (A) or three (p < 0.0001; model (B) categories. The observed risk scores utilize the molecular subtype, the expression of two cell-cycle related genes (CCND1 and MKI67) and TP53 (See also Table 5 for details).


