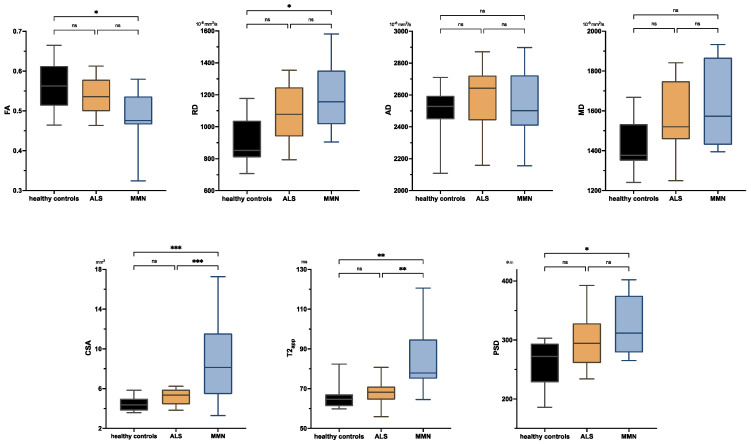
Figure 2.
Boxplots of DTI parameters (upper row), cross-sectional area (CSA), and T2-relaxometry metrics (lower row) measured in the upper-arm nerves. Asterisks represent statistical significance at p ≤ 0.05 from one-way analysis of variance with Holm–Sidak’s correction. The plots illustrate the 25–75th percentiles (boxes) and minimum-to-maximum values (whiskers). Ns, not significant.

