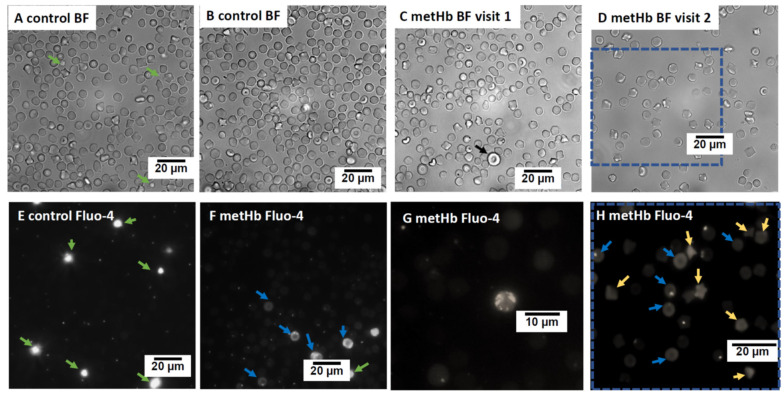
Figure 1.
Microfluorescent live cell imaging of RBCs of the affected (metHb) and control cats. Bright field (BF) images of RBCs and Ca2+ distribution (using fluorescent signal of Fluo-4 dye) from control and the affected cat. BF images of control (A,B) and the affected cat at first visit when the affected cat was anemic (C) and at second visit when in steady state (D). Panels E-H represent the Ca2+-dependent fluo-4 fluorescent signal for the RBCs of the control (E) and the affected (F–H) cats. Blue dotted frame indicates the BF and fluorescent images of the same area. Black arrow in panel C highlights an immature large RBC with distorted discoid shape. Platelets (E,F) are filled with Ca2+ and intensely stained (green arrows). Some of the discocytes (blue arrows, (F,H)) and echinocytes (yellow arrows, (H)) of the affected cat were overloaded with Ca2+. A few Ca2+-overloaded cells of the affected cat contained multiple Ca2+-filled vesicles (F,G), which are characteristic for immature reticulocytes.

