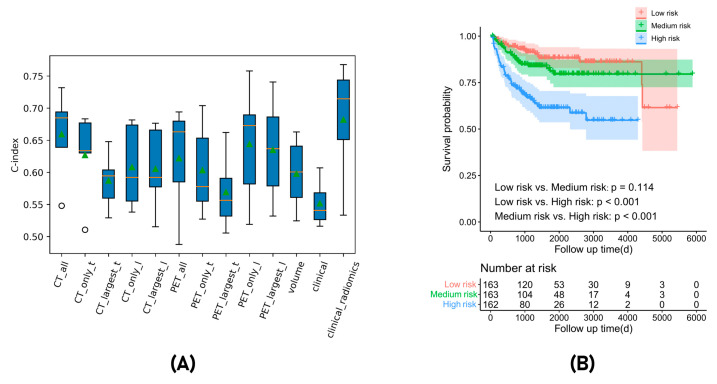
Figure 4.
(A) Box plot showing the comparative performance of radiomics features extracted from different regions of interest, clinical, volumetric features, and the final radiomics_clinical model. (B) Kaplan–Meier survival plots stratified based on the predicted risk score in fivefold cross-validation.

