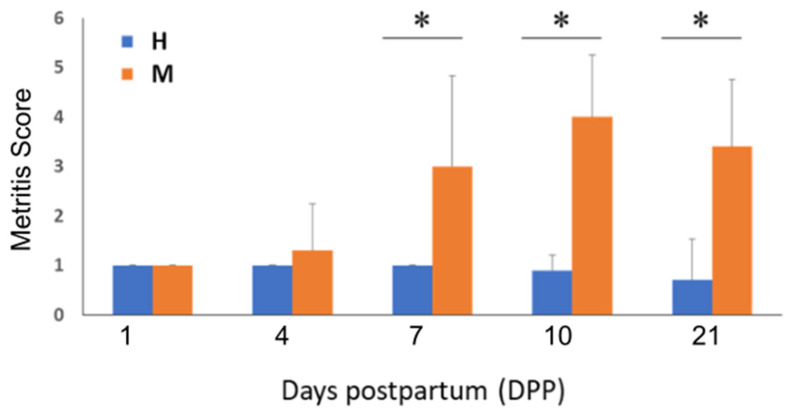
Figure 1.
Comparison of endometritis score changes during the study period. Bar graph depicting averaged metritis scores for the metritis (M) and healthy (H) animal groups from 1 to 21 DPP. * Indicates statistically significant (p < 0.01) differences between metritis and healthy animals’ endometritis scores.

