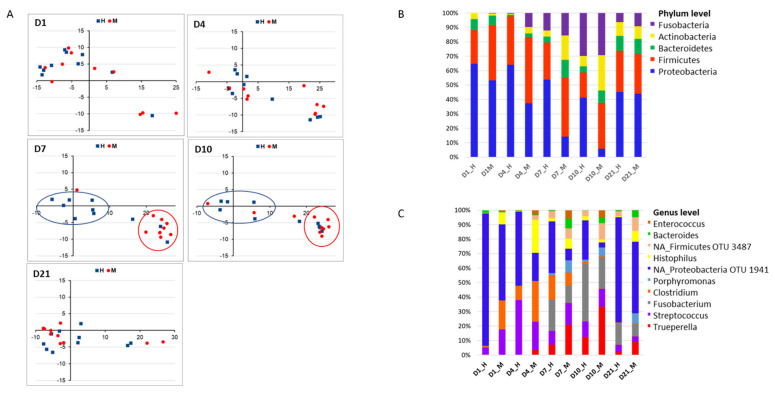
Figure 4.
Comparison of the taxonomic composition of postpartum uterine microbiomes between healthy (H) and metritis (M) animals. (A) NMDS plots based on Bray-Curtis dissimilarity distances between postpartum uterine microbiomes of individual cows for each time point. Individual points represent single cows (T = 10 for each group). Blue—healthy cows; Red—metritis cows. Bar graphs showing averaged relative abundances and distribution for the top 5 phyla (B) and top 10 genera (C). Unclassified genera are denoted by NA. Relative abundances were rescaled to account for only the 5 (phyla) and 10 (genera) most abundant phyla.

