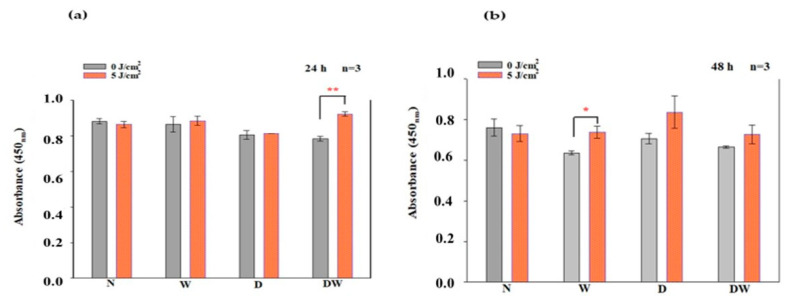
Figure 8.
Phosphorylated (p-) MEK1/2 following irradiation at 660 nm and a fluence of 5 J/cm2, as determined by ELISA in non-irradiated and irradiated normal (N), wounded (W), diabetic (D), and diabetic wounded (DW) cell models at 24 h (a) and 48 h (b) post-irradiation. Data are expressed as ±SEM (n = 3). Significant probabilities compared to the non-irradiated controls are shown as * p < 0.05 and ** p < 0.01.

