Figure 3.
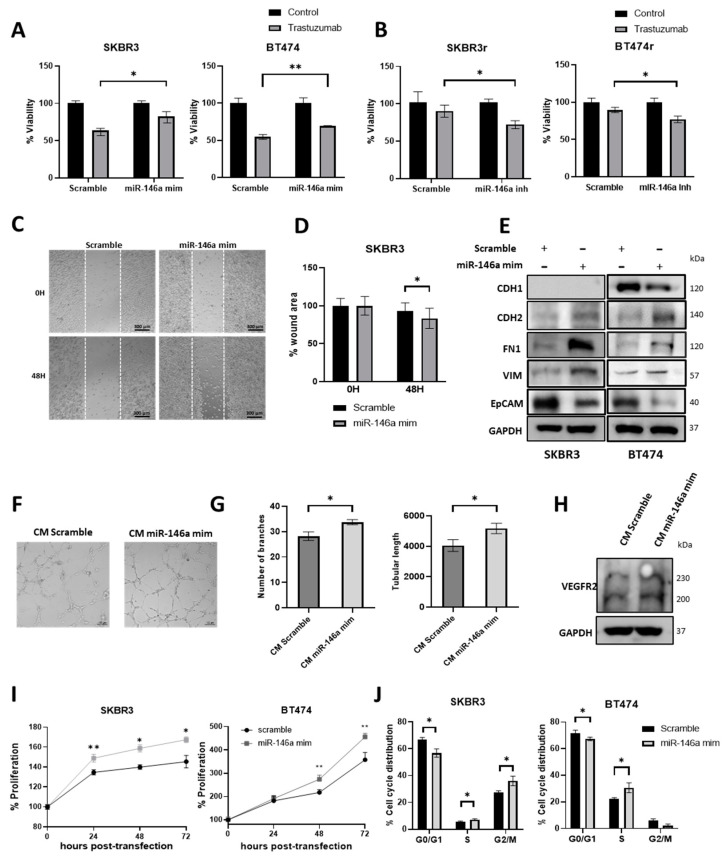
Analysis of miR-146a-5p effect in response to trastuzumab, migration, angiogenesis, proliferation, and cell cycle. (A) Viability analysis of SKBR3 and BT474 transfected with 50nM miR-146a-5p mimic (B) SKBR3r and BT474r transfected with 50 mM miR-146a-5p inhibitor (B) with or without treatment with 15 µg/mL of trastuzumab for 7 days. (C) Representative images of wound-healing cell migration assay of SKBR3 transfected with 50 nM miR-146a-5p mimic. Magnification: 10×. Scale bar: 300 µm. (D) Quantification of the remaining wound area at 0 and 48 h under conditions indicated above. (E) Expression of epithelial-to-mesenchymal transition markers (CDH1, CDH2, FN1, and VIM) and EpCAM in SKBR3 and BT474 via Western blot after 50 nM miR-146a-5p mimic transfection. GAPDH was used as loading control. (F) Representative images of in vitro angiogenesis assay of HUVEC-2 cells (10× magnification). (G) Representations of the number of branching points and the relative tubular length 8 h after addition of CM of SKBR3 transfected with miR-146a-5p or scramble control. (H) Expression of VEGFR2 in HUVEC-2 after 24 h of treatment with CM of SKBR3 transfected with miR-146a-5p mimic or scramble control. (I) Proliferation analysis of SKBR3 and BT474 transfected with 50 nM miR-146a-5p mimic or scramble at 0, 24, 48, and 72 h. (J) Cell cycle distribution of SKBR3 and BT474 cells overexpressing miR-146a-5p. Propidium iodide was used for staining, and the analysis was performed via flow cytometry. Each experiment was performed in technical and biological triplicate. * p-value < 0.05; ** p-value < 0.01. CM: Conditioned medium; CDH1: E-Cadherin; CDH2: N-cadherin; FN1; Fibronectin; VIM: Vimentin; EpCAM: Epithelial cell adhesion molecule. The uncropped blots are shown in Figure S5.

