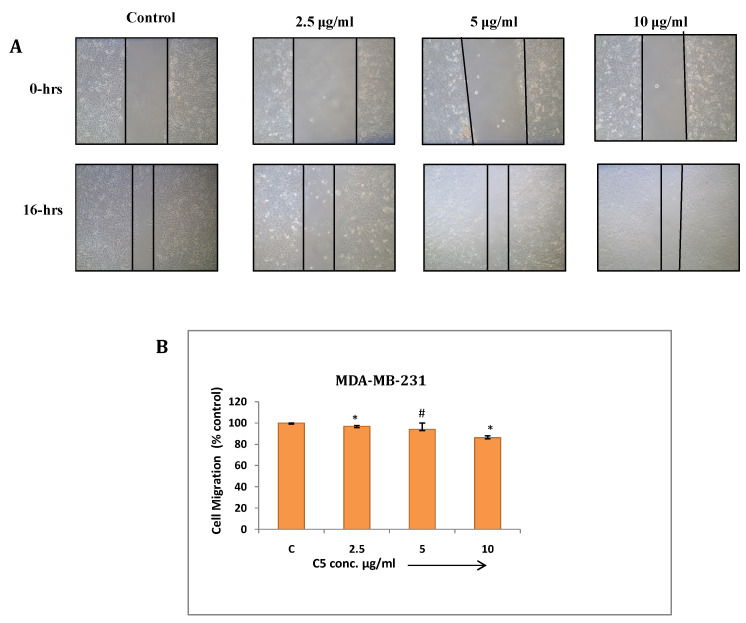
Figure 8.
(a) Cell migration assay of MDA-MB-231 cells treated with C5 compound from 2.5 to 10µg/ml for 16 hrs. Migration of cells to the wounded area was observed by using phase contrast microscope (Nikon) and photographed (10x magnification) (b) Distance migrated was measured by image-Pro plus software. Quantitation of per cent cells migration where bar graph denotes mean ± SEM (n=3). # P > 0.05 vs. control and * P ≤ 0.002 vs. control.

