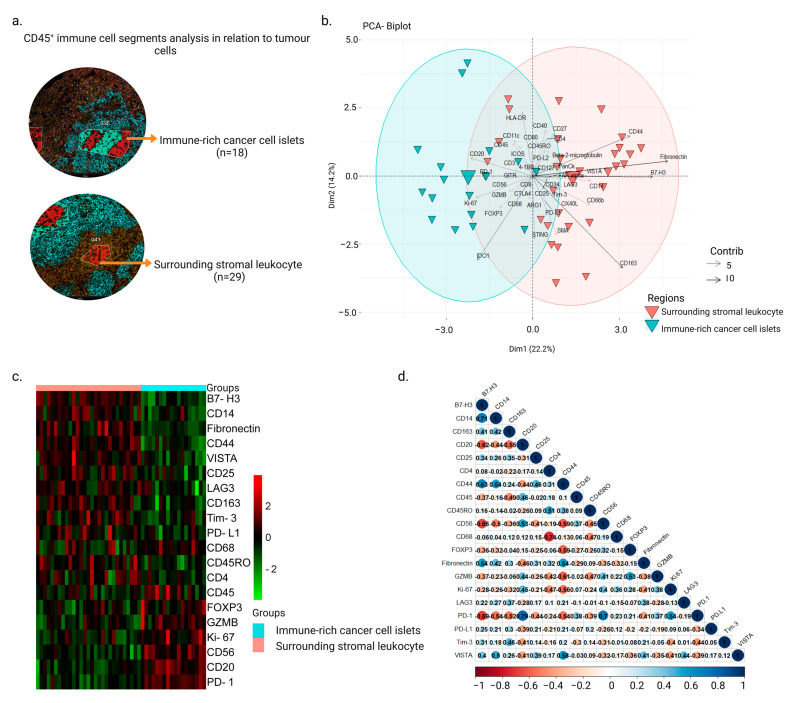
Figure 1.
Differential expression profiles in CD45+ segments from ‘immune-rich cancer cell islets’ and ‘surrounding stromal leukocyte’ regions in NPC. (a) AOIs were generated based on cell expression of the morphological markers CD45 (red), PanCK (cyan), and CD8 (magenta) from the ROIs, and the collected oligonucleotides were quantified using the GeoMx® DSP system. (b) Biplot principal component analysis showing ROI segments (AOIs) as well as protein markers on the first and second components from ‘immune-rich cancer cell islets’ and ‘surrounding stromal leukocyte’ regions. (c) Heatmap demonstrating DE proteins between ‘immune-rich cancer cell islets’ and ‘surrounding stromal leukocyte’ regions (Mann–Whitney test, p-value < 0.05). (d) Twenty DE proteins’ correlation map (Pearson’s correlation, significance taken at |r| > 0.7, p-value < 0.05).

