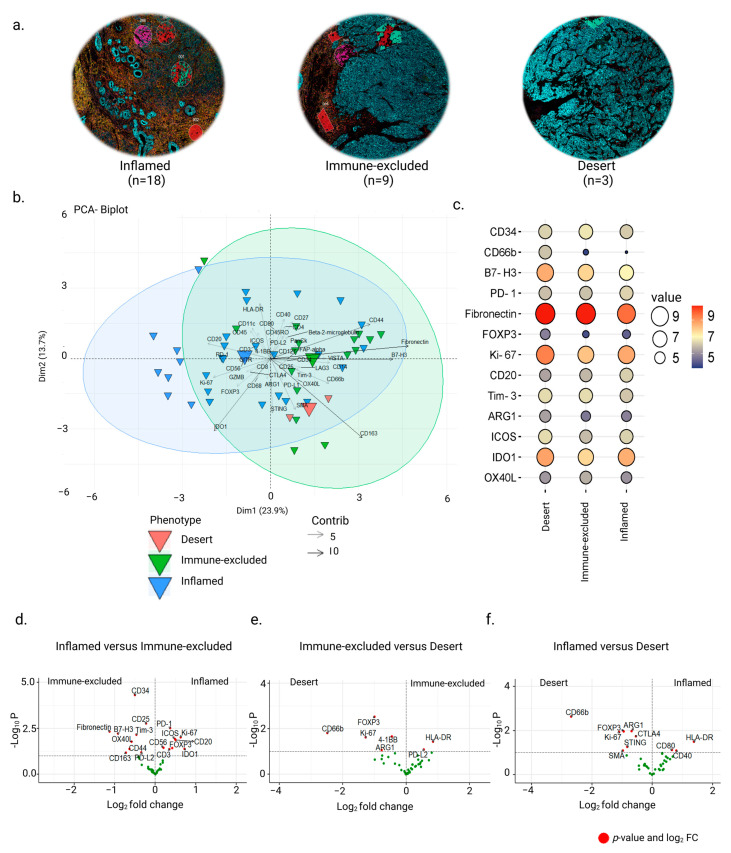
Figure 2.
Protein expression in ‘surrounding stromal leukocyte‘ regions associated with immune phenotypes of NPC. (a) Representative biopsy sections from the TMA demonstrating the three phenotypes: ‘inflamed’, ‘immune excluded’, and ‘desert’. (b) Principal component analysis showing the distribution of the AOIs associated with the three phenotypes. (c) Balloon plot showing the top DE proteins between the phenotypes (Kruskal–Wallis test, p-value < 0.05). (d–f) Volcano plots showing differences between the ’surrounding stromal leukocyte’ regions of ‘inflamed’, ‘immune-excluded’, and ‘desert’ phenotypes (Mann–Whitney test, p-value < 0.05).

