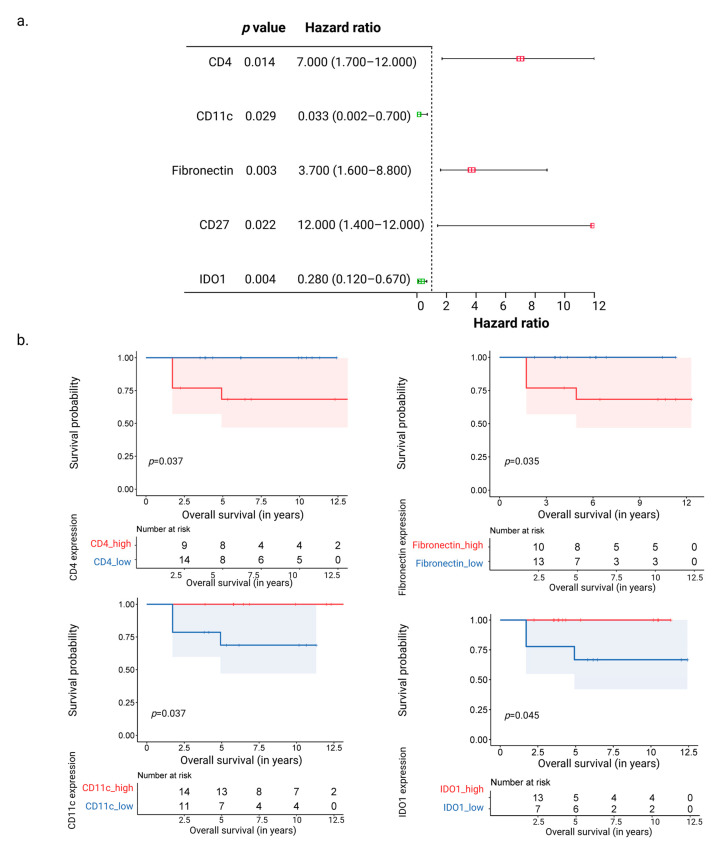
Figure 3.
Correlation of the most significant genes between groups and survival. (a) Forest plot showing the proteins associated positively (CD4, CD27, and Fibronectin) and negatively (CD11c and IDO1) with hazard ratios associated with overall survival, as seen after Cox regression analysis. (b) Kaplan–Meier plots showing the proteins (CD4, Fibronectin, CD11c, and IDO1) associated with the overall survival probability.

