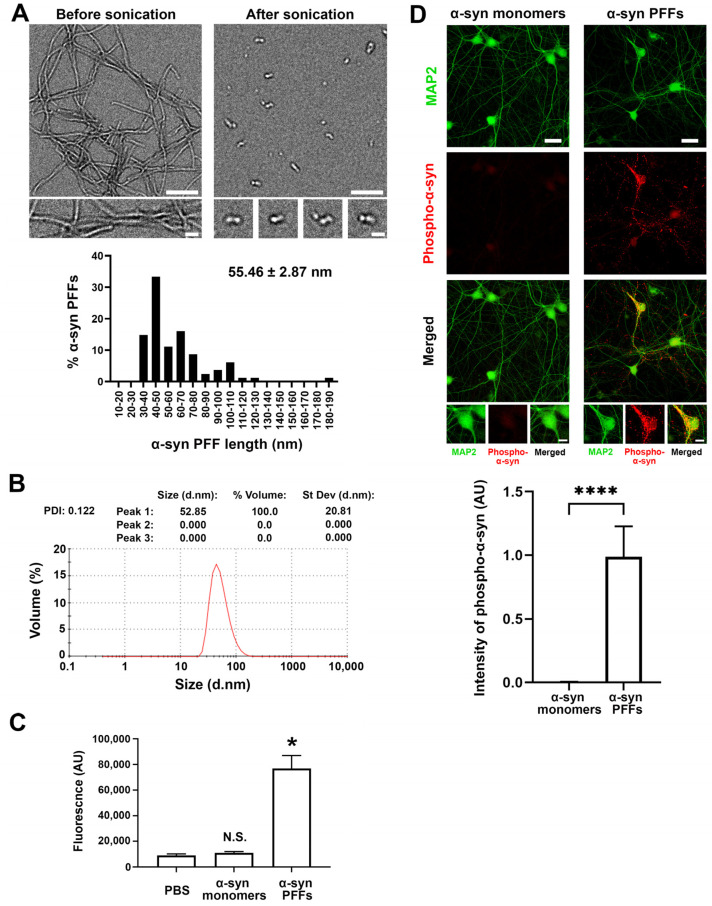
Figure 1.
Biophysical characterization of pathological α-synuclein preformed fibrils (α-syn PFFs). (A) Representative electron microscopy (EM) images (top) of α-synuclein (α-syn) proteins after aggregation incubation (left) followed by sonication (right). The sonicated aggregates were used as α-syn preformed fibrils (α-syn PFFs) in this study. Histogram (bottom) showing the lengths of α-syn PFFs. Most are between 30 and 80 nm (55.46 ± 2.87 nm (mean ± SEM, 81 α-syn PFF particles)). Scale bars: 200 μm in lower magnification images and 50 μm in higher magnification images. (B) The dynamic light scattering analysis of α-syn PFFs confirms that their average size is 52.85 nm, which is consistent with the above EM analysis, and shows that their polydispersity index (PDI) is 0.122, suggesting that they are relatively homogeneous aggregates. (C) Fluorescent quantification using thioflavin-T assays to confirm amyloid β-sheet structures in α-syn PFFs. Kruskal-Wallis one-way ANOVA, p < 0.01. * p < 0.05 and N.S., not significant, compared with PBS by a Dunn’s multiple comparisons test. Data are presented as mean ± SEM. (n = 2 samples for PBS and α-syn monomers and 6 samples for α-syn PFFs). (D) α-syn PFFs induce hyperphosphorylation of endogenous α-synuclein in the hippocampal neuron cultures. Hippocampal cultured neurons were treated with α-syn PFFs (2.5 μg/mL [174 nM monomer equivalent]) or α-syn monomers (2.5 μg/mL) at 7 days in vitro (DIV). The cultures were maintained until 14 DIV and then immunostained for phospho-α-synuclein (red) and MAP2 (green), the dendrite marker. Treatment with α-syn PFFs, but not α-syn monomers, induced clusters of phosphorylated α-synuclein immunoreactivity along neurites (middle panel, red). Bar graph (bottom) showing the intensity quantification of phospho-α-synuclein immunoreactivity in neurons treated with α-syn monomers or α-syn PFFs. Mann-Whitney U test, **** p < 0.0001. Data are presented as mean ± SEM. (n = 11 images for each from two independent experiments). Scale bars: 30 μm in lower magnification images and 10 μm in higher magnification images.

