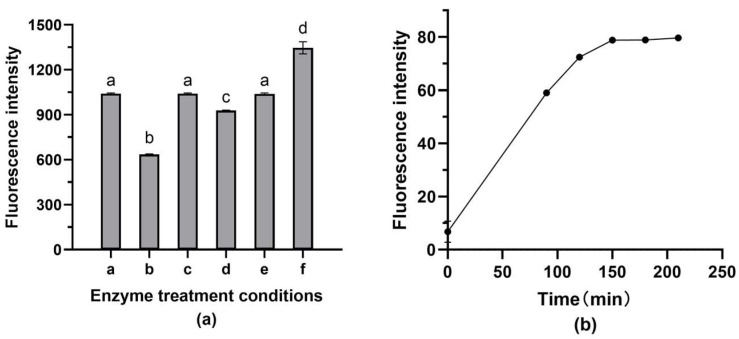
Figure 6.
Effects of enzyme treatment conditions on the fluorescent detection of S. aureus. (a) a: 1 mg/mL lysozyme; b: 1 mg/mL lysozyme and 10 μL/mg lysostaphin; c: 2 mg/mL lysozyme and 10 μL/mg lysostaphin; d: 5 mg/mL lysozyme and 10 μL/mg lysostaphin; e: 10 μL/mg lysostaphin; and f: treatment without the addition of enzymes. (b) Hybridization time. Bars show the means and the error bars show standard deviations. The a, b, c, d in the figure indicate significant differences between multiple groups.

