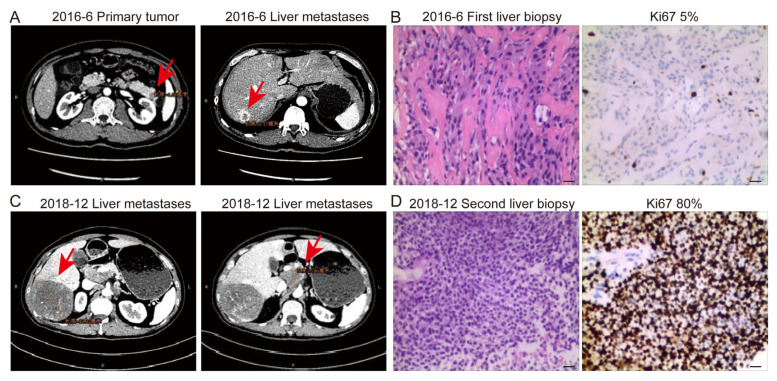
Figure 4.
Contrast-enhanced computed tomography showed primary tumor and liver metastases (red arrows) at initial diagnosis and progression. (A,C). Hematoxylin and eosin staining and immunohistochemistry staining of Ki67 of each lesion. Scale bar indicates 20 μm. The Ki67 indexes of the first and second liver biopsies were 5% (B) and 80% (D), respectively.

