Figure 2.
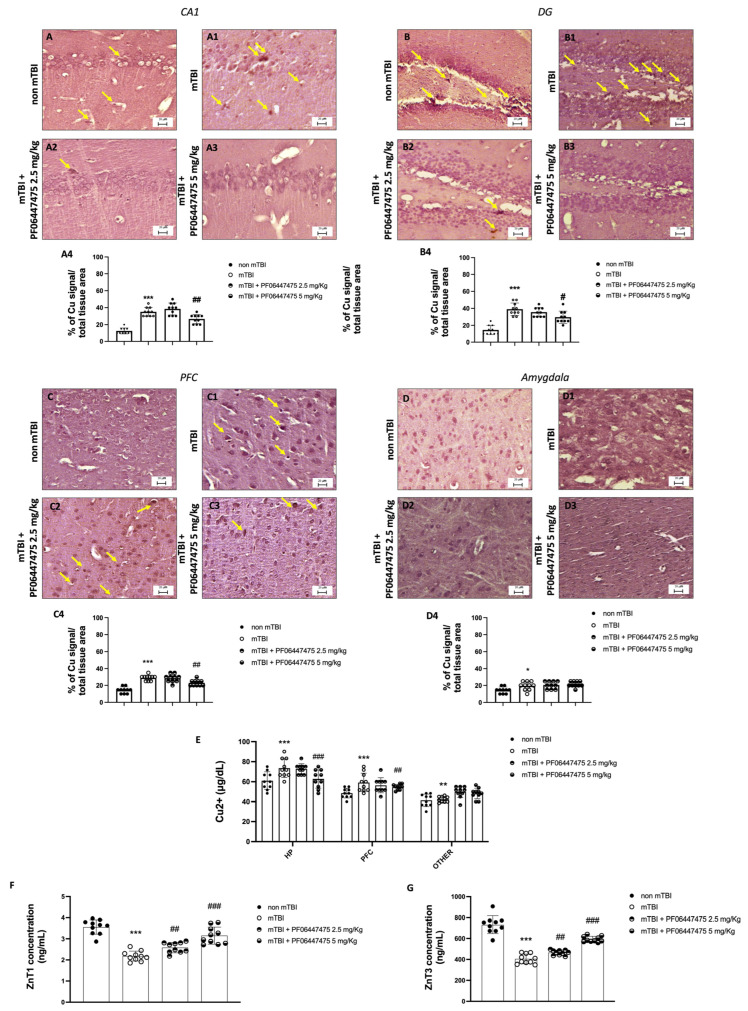
Effects of PF-475 treatments on Cu uptake after mTBI in the CA1, DG, PFC and amygdala areas. CA1 area: copper staining of the non-mTBI group (A) and the mTBI group (A1), see percentage of Cu signal over the total tissue area (A4). PF-475 2.5 mg/kg (A2) and 5 mg/kg (A3), see percentage of Cu signal over the total tissue area (A4). DG area: copper staining of the non-mTBI group (B) and the mTBI group (B1), see percentage of Cu signal over the total tissue area (B4). PF-475 2.5 mg/kg (B2) and 5 mg/kg (B3), see percentage of Cu signal over the total tissue area (B4). PFC area: copper staining of the non-mTBI group (C) and the mTBI group (C1), see percentage of Cu signal over the total tissue area (C4). PF-475 2.5 mg/kg (C2) and 5 mg/kg (C3), see percentage of Cu signal over the total tissue area (C4). Amygdala area: copper staining of the non-mTBI group (D) and the mTBI group (D1), see percentage of Cu signal over the total tissue area (D4). PF-475 2.5 mg/kg (D2) and 5 mg/kg (D3), see percentage of Cu signal over the total tissue area (D4). Copper accumulation (E). The concentration of ZnT1 and ZnT3 in brain tissues (F,G). Data are expressed as SD from 10 mice for each group. Two-way ANOVA test. * p < 0.05, ** p < 0.01 and *** p < 0.001 vs. non mTBI; # p < 0.05, ## p < 0.01 and ### p < 0.001 vs. mTBI.

