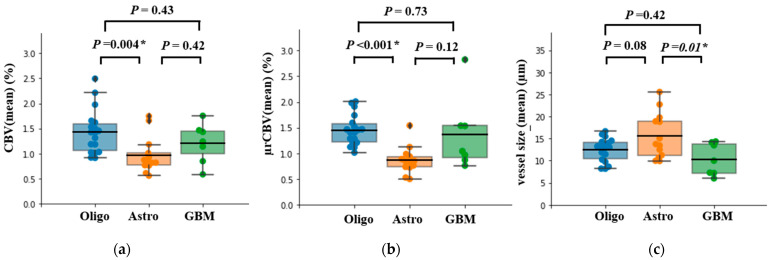
Figure 2.
Box plot of MRI-derived measurements of (a) CBV, (b) µCBV, and (c) vessel size, with mean bar for the three glioma subtypes Oligo (IDH-mut &1p/19q codeleted), Astro (IDH-mut), and GBM (IDH-wt). Tukey HSD test or Dunn’s test using a Bonferroni correction was used for pairwise statistical analysis. ‘*’ indicates significant difference between two subtypes accompanied by the exact p-value.

