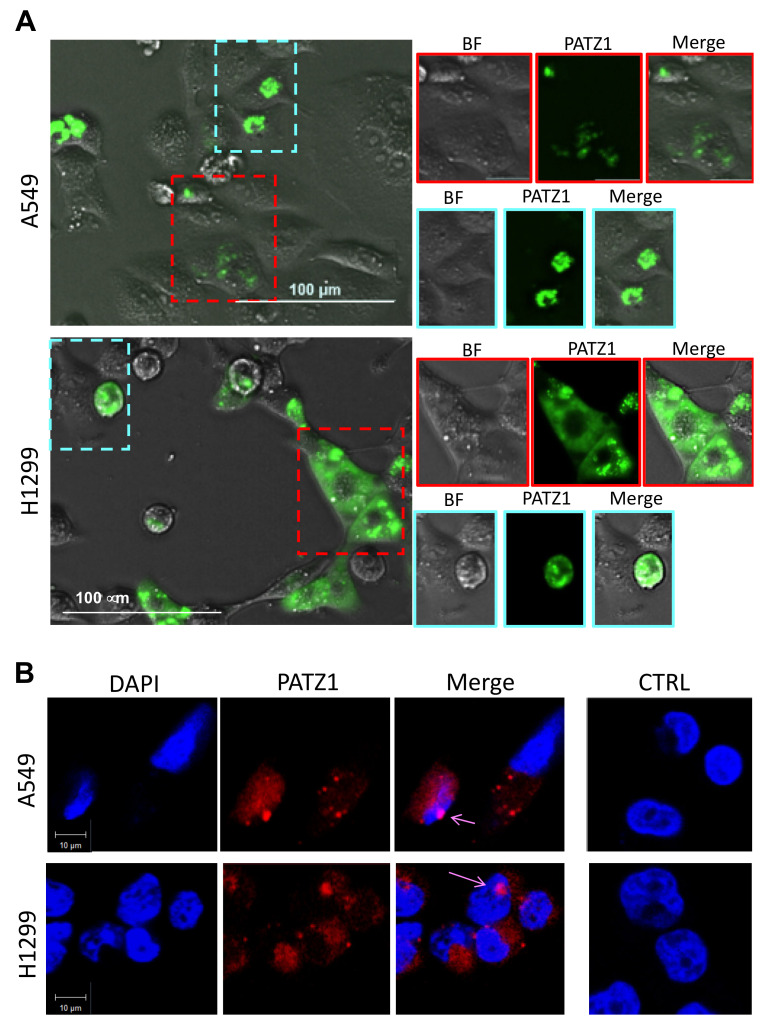
Figure 6.
PATZ1 subcellular distribution in A549 and H1299 transfected cells. (A) Fluorescent microscopy in living cells showing the merging images of green fluorescent PATZ1 protein and bright field. Dotted frames enclose cells in which PATZ1 expression appears localized in the nucleus (cyan) or cytoplasm (red). Outsets on the right report each single bright field (BF), green (PATZ1) and merge image of the insets. Scale bar: 100 μm. (B) Representative confocal fluorescence images on PFA-fixed cells stained with DAPI. Single fluorescence detection of either DAPI (blue) or PATZ1 (red) and digital merge of the images are shown. Colocalization (pink) of PATZ1 and DAPI is indicated by arrows. Negative control (CTRL) represented by untransfected cells is shown on the right. Scale bar: 10 μm.

