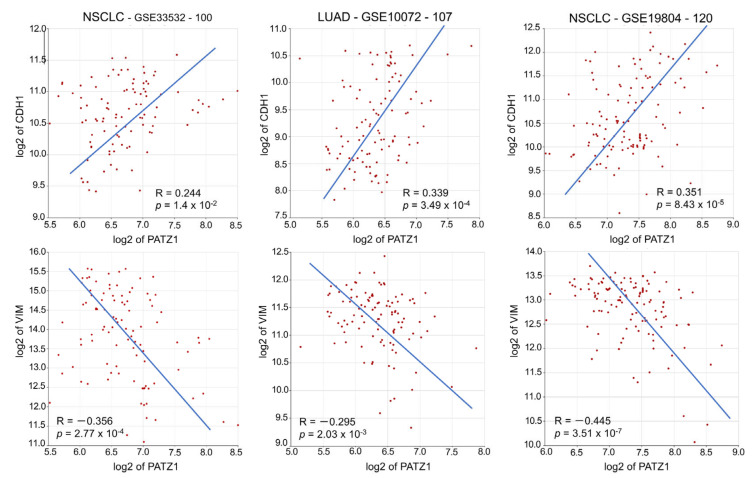
Figure 7.
PATZ1 negatively correlates with EMT in NSCLC. XY-dot plots showing the correlation between PATZ1 (X-axis) and CDH1 (Y-axis) or VIM (Y-axis) gene expression in three publicly available gene expression NSCLC datasets analyzed via the R2: Genomic Analysis and Visualization platform [36].

