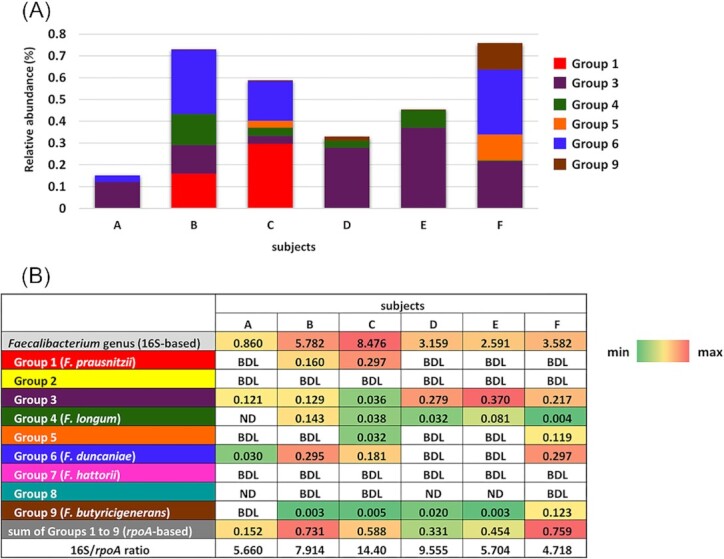
Figure 4.

Relative abundance (%) of each group and the Faecalibacterium genus against total bacteria in six healthy adults. Samples were run in triplicate in the same plate, and the mean was obtained. Stacked bars (A) indicating the relative abundance of each group (rpoA-based) in the six subjects. Colours in the stacked bars indicate Groups. Groups 2, 7, and 8 were not indicated, since they were ND or BDL in all subjects tested. In (B), the relative abundance of each group (rpoA-based) and the genus Faecalibacterium (16S-based) are shown as a heat map, and relative abundance values are indicated. The 16S/rpoA ratio was calculated based on the relative abundance of the genus Faecalibacterium and the sum of the relative abundance of Groups 1–9. ND, not detected. BDL, below the detection limit.
