. 2023 Mar 20;14(15):4102–4113. doi: 10.1039/d3sc00020f

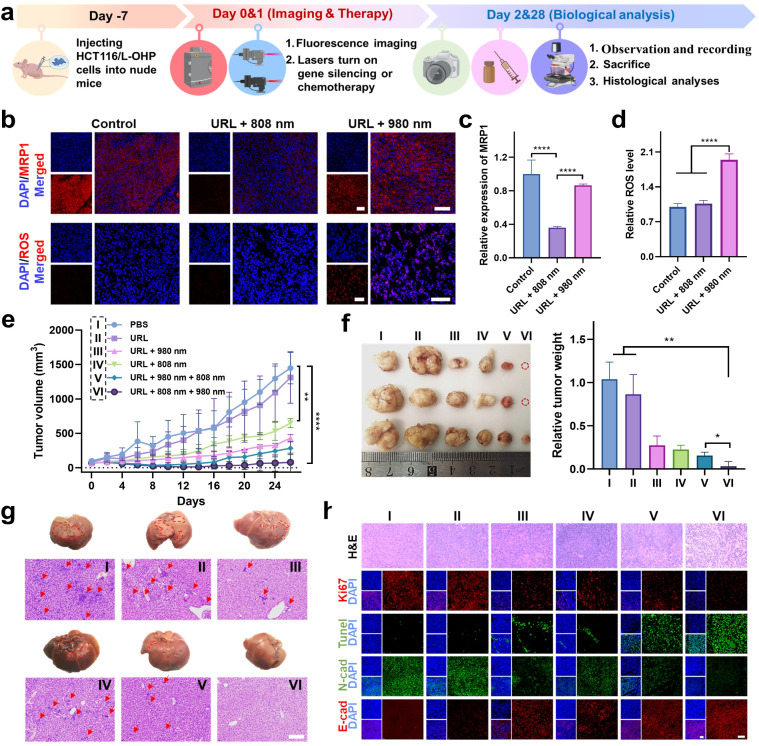
Fig. 6. Orthogonally reversing chemoresistance for enhanced chemo-photodynamic therapy in vivo. (a) Scheme of the protocol for establishment of an HCT116/L-OHP tumor model. (b) Histological staining images of MRP1 and ROS levels in tumor slices of mice after the indicated treatments. (c and d) Quantitative histological analysis showing the significantly decreased MRP1 expression (c) and increased ROS levels (d) after NIR light irradiation. (e) Tumor growth curves after treatment. (f) Digital photos and weight of tumor tissues collected from mice at the end of treatment. The red circles indicate that tumors disappeared in the URL + 808 + 980 nm group at the end of treatment. (g) Digital photos and the corresponding H&E staining of livers collected from mice in the different groups at the end of treatment. The red circled area contains the white tissue observed on the liver surface, and the red arrows indicate the tumor focus on the slice. Scale bar: 200 μm. (h) Representative H&E staining, immunofluorescence analysis of proliferation (Ki67, red) and apoptosis (TUNEL, green), and immunofluorescence co-staining for N-cadherin (green) and E-cadherin (red) in tumor sections. Scale bar: 100 μm. **P < 0.01, and ****P < 0.0001.

Fig. 6