Figure 6.
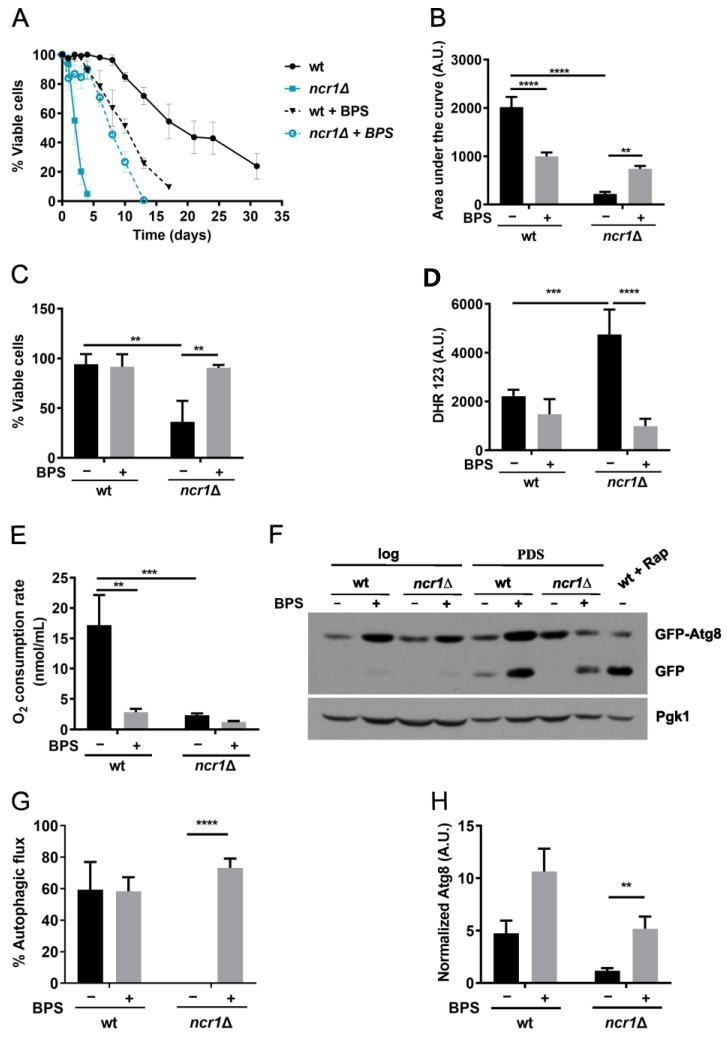
Chelating iron with BPS increases the chronological lifespan, oxidative stress resistance, and autophagic flux of ncr1∆ cells. (A) Wild-type and ncr1Δ cells were grown to post-diauxic shift [(PDS), 24 h after log] phase and maintained overtime in SC medium (wt, ncr1∆) or SC medium supplemented with 80 µM of BPS (wt + BPS, ncr1∆ + BPS). Cellular viability was expressed as the percentage of the colony-forming units in relation to day 0. Data are the mean ± SEM of at least three independent experiments. (B) The area under each lifespan curve was computed using GraphPad in arbitrary units (A.U.). Data are the mean ± SEM. ** p ≤ 0.01; ****, p ≤ 0.0001 (one-way ANOVA). (C) Cells were grown to PDS (24 h after log) phase in medium supplemented or not with 80 µM of BPS and exposed to 5 mM H2O2 for 1 h. Cell viability was measured as the percentage of the colony-forming unit (treated cells vs. non-stressed cells). Values are the mean ± SD. ** p ≤ 0.01 (two-way ANOVA). (D) Cells were grown to PDS (48 h after log) phase in medium supplemented or not with 80 µM of BPS and intracellular reactive oxygen species were analyzed by flow cytometry, using Dihydrorhodamine 123 (DHR123) as probe. Data are the mean ± SD. *** p ≤ 0.001; **** p ≤ 0.0001 (two-way ANOVA). (E) Cells were grown to PDS (24 h after log) phase in medium supplemented or not with 80 µM of BPS and oxygen consumption rates were measured. Values are the mean ± SD (two-way ANOVA), ** p ≤ 0.01, *** p ≤ 0.001. (F) Cells carrying pRS416-GFP-ATG8 were grown to exponential (log) and PDS (48 h after log) phases in medium supplemented or not with 80 µM of BPS. Proteins were analyzed by immunoblotting using anti-GFP antibody. As positive control, wild-type cells grown to exponential were treated with rapamycin (200 ng mL−1) for 4 h (wt + Rap). A representative blot of at least three independent experiments is shown. The original blots are shown in Supplementary Figure S8. (G) Autophagic flux was calculated by the ratio between the free GFP signal and the sum of free GFP and GFP-Atg8 signals. Values are the mean ± SEM. **** p ≤ 0.0001 (Multiple Student’s t-tests). (H) Atg8 levels were calculated by the ratio between free GFP plus GFP-Atg8 and Pgk1 signals. Values are the mean ± SEM. ** p ≤ 0.01 (Multiple Student’s t-tests).

