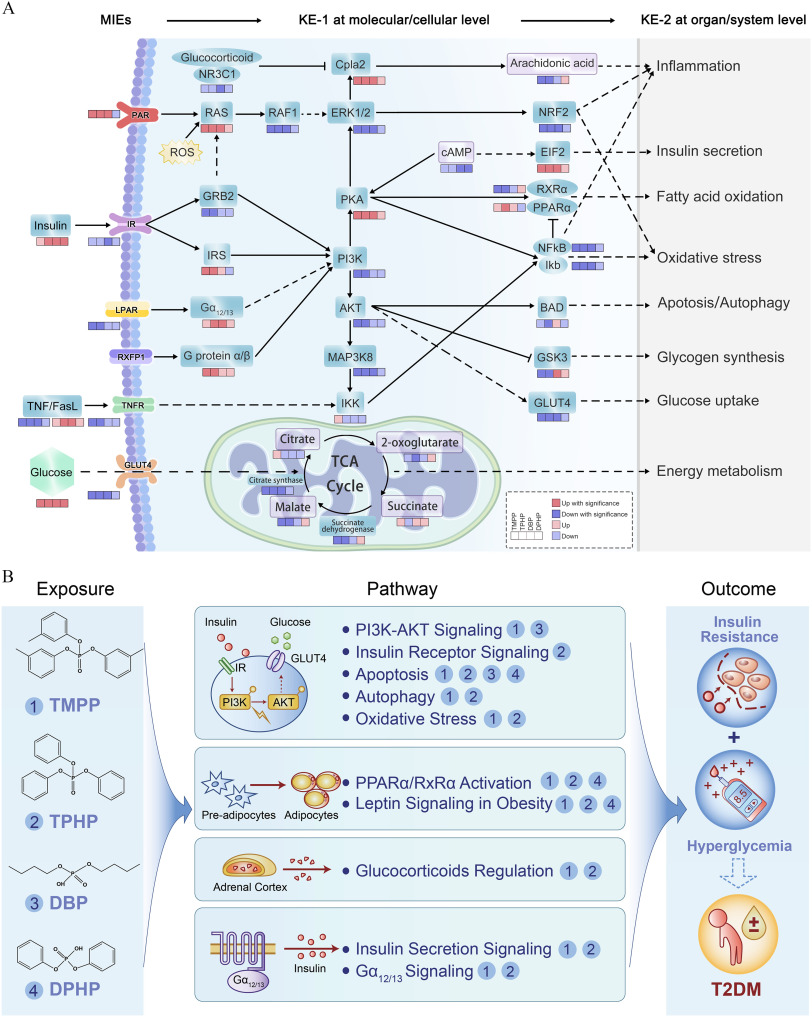
Figure 7.
AOP linking OPE exposure and adverse outcome and schematic of the putative biological mechanisms of OPEs exposure–induced type 2 diabetes outcome. (A) An AOP diagram depicting the MIEs in response to exposure to the key OPEs and the subsequent series of KEs, for example, multiple signal transduction and metabolic pathway perturbations (KE-1 at the molecular/cellular level) and impaired biological functions (KE-2 at the organ/system level), which ultimately induced glycometabolic disorder-related adverse outcomes. Alterations of genes (blue) and metabolites (purple) are represented with colored boxes. (B) Schematic of the putative biological mechanisms that mediate the linkages between OPEs exposure and apical type 2 diabetes outcome. Note: AOP, adverse outcome pathway; KEs, key events; MIEs, molecular initiating events; OPE, organophosphate ester; T2DM, type 2 diabetes mellitus.

