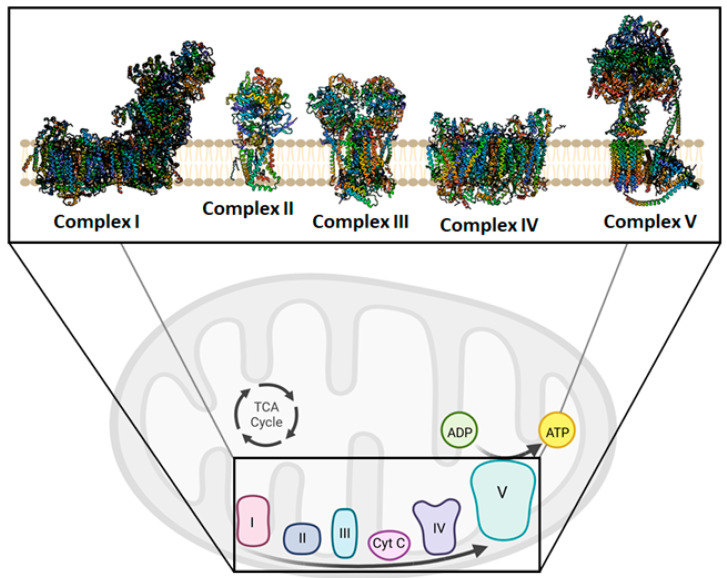
Figure 2.
Overview of the mitochondrial oxidative phosphorylation. In the insert, Complex I, II, III, IV, and V are shown in their free form drawn as ribbon representations, obtained from modified PDB IDs: 6YJ4, 1ZOY, 6FO0, 7CP5, and 6TT7, respectively. This figure was created using BioRender (17 December 2022; https://biorender.com/).

