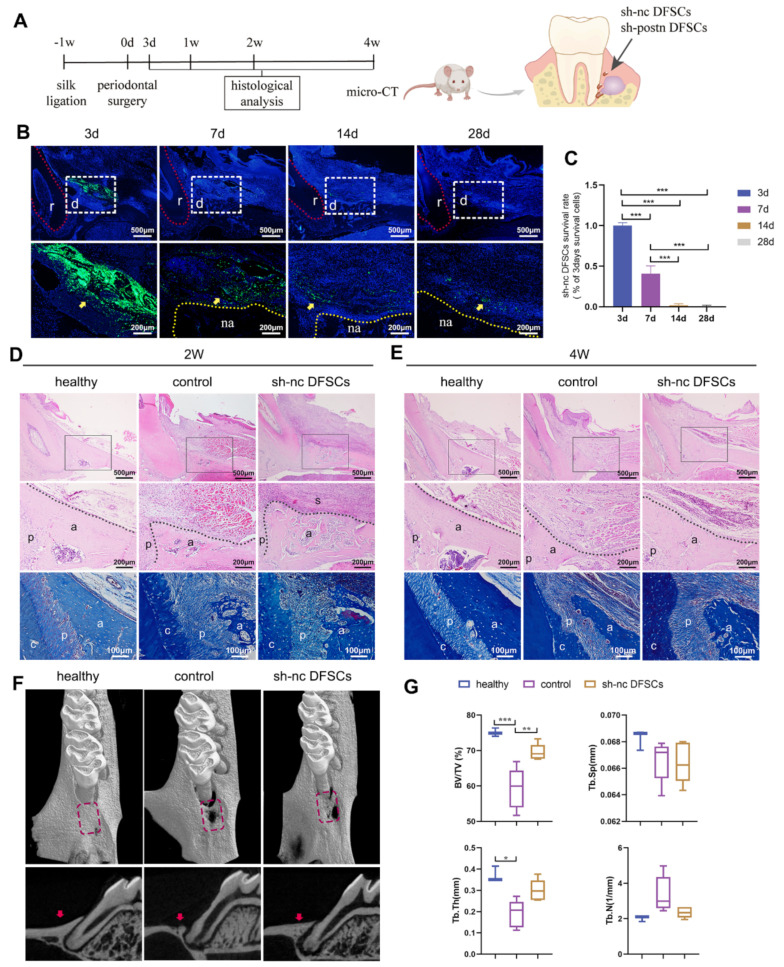
Figure 1.
The therapeutic effect and survival rate of DFSCs. (A) Schematic illustration of animal model. Fluorescence images (B) and related analysis (C) of DFSC survival. The red dotted line indicates the root. The data were analyzed by one-way analysis of variance (ANOVA) and Bonferroni post hoc test (n = 3). The white dashed box indicates the defect area. The yellow dotted line indicates the alveolar bone. The yellow arrow indicates DFSCs. r: root; d: defect area; na: newly formed alveolar bone. HE and Masson’s trichrome (MT) staining at 2 weeks (D) and 4 weeks (E). Middle panel represents a magnified view of the black box in the upper panel. The black dotted line shows the newly formed alveolar bone. a: alveolar bone; c: cementum; p: periodontal ligament, s: DFSC sheet. Micro-computed tomography (micro-CT) images (F) and quantitative assessment (G) of the defect area at 4 weeks (n = 5). The data of Tb.Sp and Tb.N were analyzed by one-way ANOVA and Bonferroni post hoc test. The data of Tb.Th did not follow normal distribution and were analyzed by Kruskal-Wallis test. The rectangular area and red arrow indicate the defect area in the 3D and sagittal views, respectively. * p < 0.05; ** p < 0.01; *** p < 0.001. Error bars represent means ± SD.

