Figure 5.
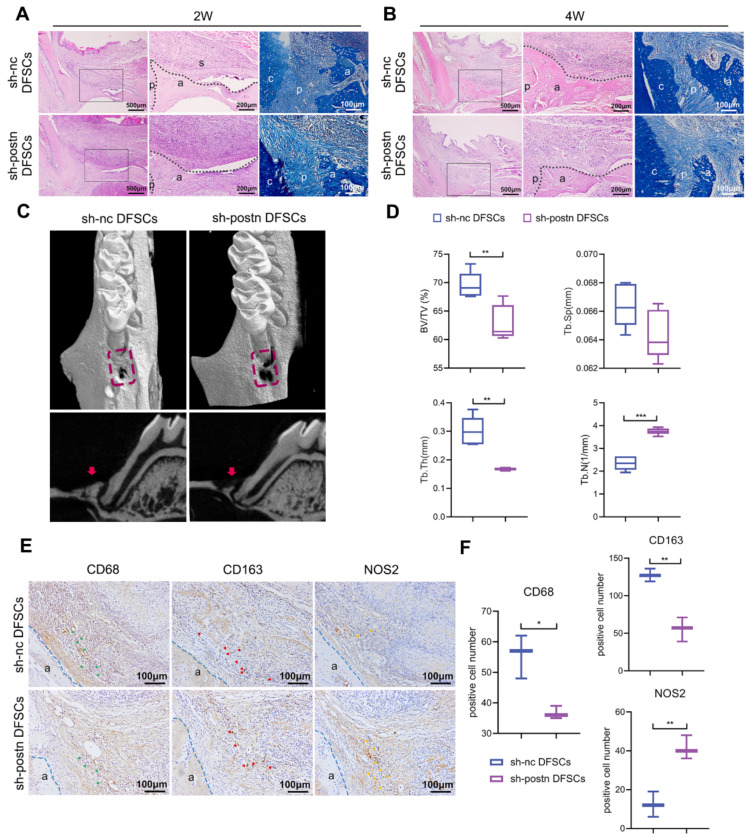
Silencing periostin affected the ability of DFSCs to promote periodontal regeneration. HE and MT staining of periodontal regeneration at 2 weeks (A) and 4 weeks (B). Middle panel represents a magnified view indicated by the black box in the left panel. The black dotted line shows the edge of the newly formed alveolar bone. a: alveolar bone; c: cementum; p: periodontal ligament; s: DFSCs sheet. Micro-CT images (C) and quantitative assessment (D) of the defect area at 4 weeks (n = 5). The red dotted box indicates the defect area and the red arrow indicates regenerated alveolar bone. The data of BV/TV, Tb.Sp, and Tb.N were analyzed by unpaired two-tailed Student’s t test. Unpaired two-tailed t tests with Welch correction were used for Tb.Th. The immunochemistry images (E) and quantification analysis (F) of the CD68+, CD163+, and NOS2+ cells on day 14 after surgery. green arrows: CD68+ cells; red arrows: CD163+ cells; yellow arrows: NOS2+ cells. The data were analyzed by unpaired two-tailed Student’s t test (n = 3). The blue dotted line indicates the outline of the alveolar bone. a: alveolar bone; p: periodontal ligament. * p < 0.05; ** p < 0.01; *** p < 0.001. Error bars represent means ± SD.

